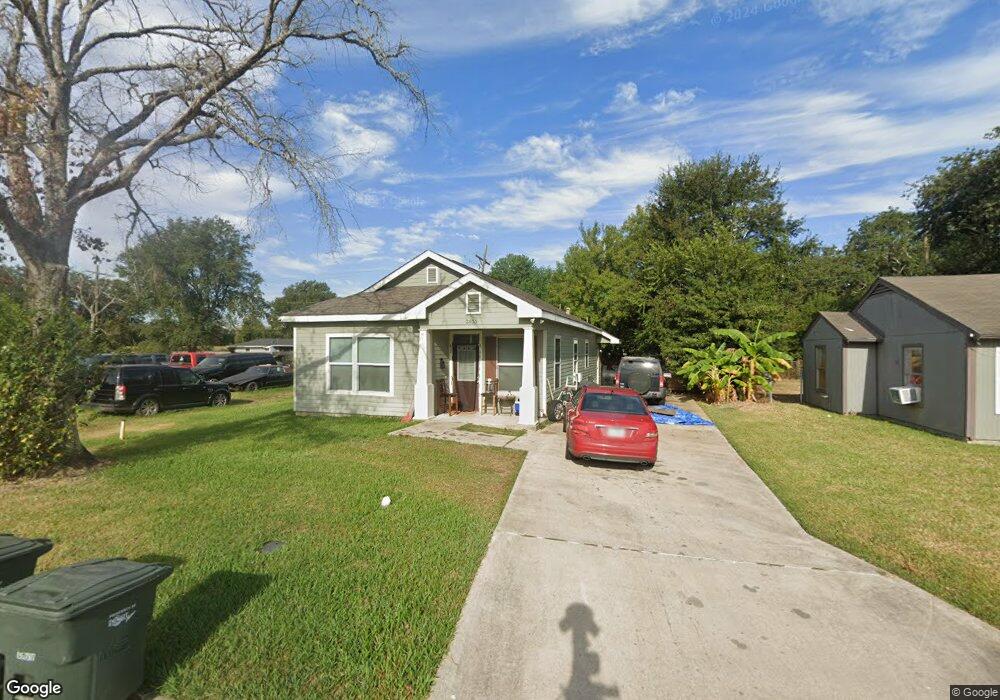
2635 31st St Port Arthur, TX 77640
Estimated Value: $118,000 - $152,000
--
Bed
--
Bath
1,300
Sq Ft
$106/Sq Ft
Est. Value
About This Home
This home is located at 2635 31st St, Port Arthur, TX 77640 and is currently estimated at $137,398, approximately $105 per square foot. 2635 31st St is a home located in Jefferson County with nearby schools including Houston Elementary School, Abraham Lincoln Middle School, and Memorial High School.
Ownership History
Date
Name
Owned For
Owner Type
Purchase Details
Closed on
Aug 20, 2007
Sold by
Snowden Arnold
Bought by
Dennis Stacy
Current Estimated Value
Home Financials for this Owner
Home Financials are based on the most recent Mortgage that was taken out on this home.
Original Mortgage
$3,300
Interest Rate
6.64%
Mortgage Type
Seller Take Back
Purchase Details
Closed on
Feb 14, 2006
Sold by
Potts Ruth
Bought by
Snowden Arnold
Create a Home Valuation Report for This Property
The Home Valuation Report is an in-depth analysis detailing your home's value as well as a comparison with similar homes in the area
Home Values in the Area
Average Home Value in this Area
Purchase History
| Date | Buyer | Sale Price | Title Company |
|---|---|---|---|
| Dennis Stacy | -- | None Available | |
| Snowden Arnold | $8,000 | None Available |
Source: Public Records
Mortgage History
| Date | Status | Borrower | Loan Amount |
|---|---|---|---|
| Closed | Dennis Stacy | $3,300 |
Source: Public Records
Tax History Compared to Growth
Tax History
| Year | Tax Paid | Tax Assessment Tax Assessment Total Assessment is a certain percentage of the fair market value that is determined by local assessors to be the total taxable value of land and additions on the property. | Land | Improvement |
|---|---|---|---|---|
| 2025 | $579 | $107,503 | -- | -- |
| 2024 | $579 | $97,730 | -- | -- |
| 2023 | $579 | $88,845 | $0 | $0 |
| 2022 | $2,565 | $80,768 | $0 | $0 |
| 2021 | $2,434 | $112,188 | $2,604 | $109,584 |
| 2020 | $1,585 | $66,750 | $2,604 | $64,146 |
| 2019 | $2,127 | $66,750 | $2,600 | $64,150 |
| 2018 | $1,529 | $66,750 | $2,600 | $64,150 |
| 2017 | $1,482 | $66,750 | $2,600 | $64,150 |
| 2016 | $579 | $19,750 | $2,600 | $17,150 |
| 2015 | $369 | $21,900 | $2,600 | $19,300 |
| 2014 | $369 | $21,900 | $2,600 | $19,300 |
Source: Public Records
Map
Nearby Homes