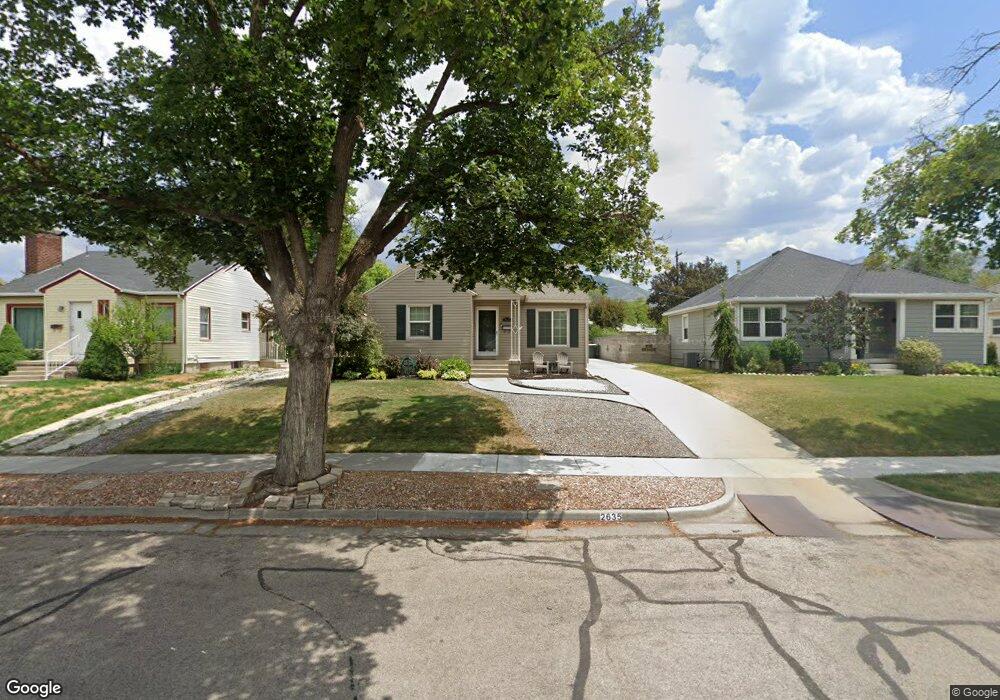
2635 Glenmare St Salt Lake City, UT 84106
Sugar House NeighborhoodEstimated Value: $630,000 - $717,483
3
Beds
2
Baths
1,700
Sq Ft
$408/Sq Ft
Est. Value
About This Home
This home is located at 2635 Glenmare St, Salt Lake City, UT 84106 and is currently estimated at $693,371, approximately $407 per square foot. 2635 Glenmare St is a home located in Salt Lake County with nearby schools including Highland Park Elementary School, Hillside Middle School, and Highland High School.
Ownership History
Date
Name
Owned For
Owner Type
Purchase Details
Closed on
Feb 11, 2021
Sold by
Nelson Travis A
Bought by
Nelson Travis A and Nelson Melanie M
Current Estimated Value
Home Financials for this Owner
Home Financials are based on the most recent Mortgage that was taken out on this home.
Original Mortgage
$166,000
Outstanding Balance
$122,072
Interest Rate
2.65%
Mortgage Type
New Conventional
Estimated Equity
$571,299
Purchase Details
Closed on
Mar 30, 2016
Sold by
Nelson Daniel W and Nelson Cynthia T
Bought by
Nelson Travis A
Home Financials for this Owner
Home Financials are based on the most recent Mortgage that was taken out on this home.
Original Mortgage
$180,000
Interest Rate
3.62%
Mortgage Type
New Conventional
Purchase Details
Closed on
Dec 28, 2013
Sold by
Nelson Daniel W and Nelson Cynthia T
Bought by
Nelson Travis A
Purchase Details
Closed on
Aug 11, 2011
Sold by
Galvin Shani and Oschner Shani G
Bought by
Nelson Travis A and Nelson Daniel W
Home Financials for this Owner
Home Financials are based on the most recent Mortgage that was taken out on this home.
Original Mortgage
$185,440
Interest Rate
4.46%
Mortgage Type
New Conventional
Purchase Details
Closed on
Sep 26, 2005
Sold by
Ochsner Michael
Bought by
Galvin Shani
Home Financials for this Owner
Home Financials are based on the most recent Mortgage that was taken out on this home.
Original Mortgage
$215,200
Interest Rate
5.81%
Mortgage Type
Purchase Money Mortgage
Purchase Details
Closed on
Mar 21, 2003
Sold by
Rojas Terrie A and Ortega Teresa M
Bought by
Rojas Terrie A and Ortega Teresa M
Home Financials for this Owner
Home Financials are based on the most recent Mortgage that was taken out on this home.
Original Mortgage
$151,000
Interest Rate
5.79%
Purchase Details
Closed on
May 1, 2002
Sold by
Ortega Teresa M and Rojas Terrie A
Bought by
Rojas Terrie A and Ortega Teresa M
Home Financials for this Owner
Home Financials are based on the most recent Mortgage that was taken out on this home.
Original Mortgage
$155,000
Interest Rate
7.13%
Purchase Details
Closed on
May 21, 1998
Sold by
Hawley Greg A and Hawley Maria D
Bought by
Ortega Teresa M and Rojas Terrie A
Home Financials for this Owner
Home Financials are based on the most recent Mortgage that was taken out on this home.
Original Mortgage
$156,655
Interest Rate
7.07%
Create a Home Valuation Report for This Property
The Home Valuation Report is an in-depth analysis detailing your home's value as well as a comparison with similar homes in the area
Home Values in the Area
Average Home Value in this Area
Purchase History
| Date | Buyer | Sale Price | Title Company |
|---|---|---|---|
| Nelson Travis A | -- | Bay National Title Company | |
| Nelson Travis A | -- | First American Title Park Ci | |
| Nelson Travis A | -- | None Available | |
| Nelson Travis A | -- | First American Title | |
| Galvin Shani | -- | First American Title | |
| Galvin Shani A | -- | First American Title | |
| Rojas Terrie A | -- | Sutherland Title | |
| Rojas Terrie A | -- | Merrill Title | |
| Ortega Teresa M | -- | First American Title |
Source: Public Records
Mortgage History
| Date | Status | Borrower | Loan Amount |
|---|---|---|---|
| Open | Nelson Travis A | $166,000 | |
| Closed | Nelson Travis A | $180,000 | |
| Previous Owner | Nelson Travis A | $185,440 | |
| Previous Owner | Galvin Shani A | $215,200 | |
| Previous Owner | Rojas Terrie A | $151,000 | |
| Previous Owner | Rojas Terrie A | $155,000 | |
| Previous Owner | Ortega Teresa M | $156,655 |
Source: Public Records
Tax History Compared to Growth
Tax History
| Year | Tax Paid | Tax Assessment Tax Assessment Total Assessment is a certain percentage of the fair market value that is determined by local assessors to be the total taxable value of land and additions on the property. | Land | Improvement |
|---|---|---|---|---|
| 2025 | $2,746 | $665,100 | $215,800 | $449,300 |
| 2024 | $2,746 | $523,900 | $209,200 | $314,700 |
| 2023 | $2,719 | $500,100 | $175,800 | $324,300 |
| 2022 | $2,836 | $489,400 | $172,400 | $317,000 |
| 2021 | $2,556 | $399,300 | $132,600 | $266,700 |
| 2020 | $2,461 | $365,900 | $122,500 | $243,400 |
| 2019 | $2,357 | $329,800 | $113,100 | $216,700 |
| 2018 | $2,217 | $302,100 | $113,100 | $189,000 |
| 2017 | $2,296 | $293,100 | $113,100 | $180,000 |
| 2016 | $2,153 | $261,000 | $113,100 | $147,900 |
| 2015 | $2,195 | $252,200 | $115,400 | $136,800 |
| 2014 | -- | $241,900 | $113,100 | $128,800 |
Source: Public Records
Map
Nearby Homes
- 1597 E 2700 S
- 2534 S Imperial St
- 2689 S 1700 E
- 2649 S 1800 E
- 2795 S Imperial St
- 2759 Chadwick St E
- 1815 E Hillcrest Ave
- 2663 Melbourne St
- 1838 E Hillcrest Ave
- 2692 Wellington St E
- 2872 S Imperial St
- 2742 Alden St E
- 2626 S Preston St
- 2692 Preston St
- 1925 E Hillcrest Ave
- 2864 Beverly St E
- 1252 E Driggs Ave
- 1821 Bosham Ln S
- 2710 S Highland Dr Unit 11
- 2965 S 1400 E
- 2635 S Glenmare St
- 2629 S Glenmare St
- 2641 Glenmare St
- 2629 Glenmare St
- 2647 S Glenmare St
- 2647 Glenmare St
- 2625 Glenmare St
- 2625 S Glenmare St
- 2636 S Hartford St
- 2636 S Hartford St
- 2630 Hartford St
- 2642 Hartford St
- 2630 S Hartford St
- 2642 S Hartford St
- 2653 S Glenmare St
- 2653 Glenmare St
- 2648 S Hartford St
- 2648 Hartford St
- 2626 Hartford St
- 2654 Hartford St