Estimated Value: $442,008 - $466,000
3
Beds
2
Baths
1,835
Sq Ft
$248/Sq Ft
Est. Value
About This Home
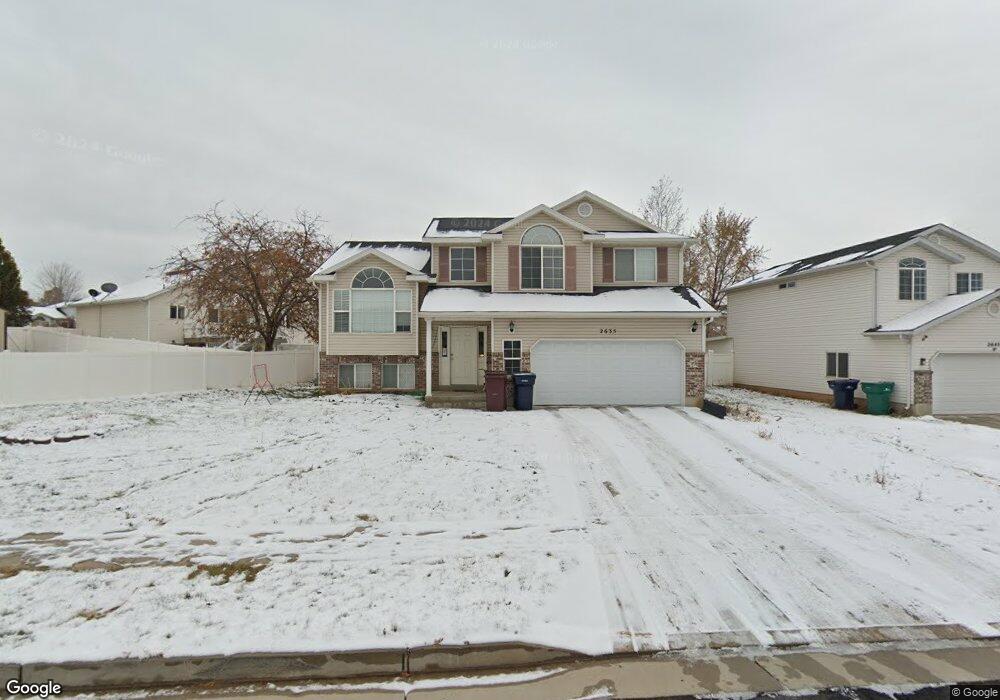
This home is located at 2635 W 4100 S, Roy, UT 84067 and is currently estimated at $454,752, approximately $247 per square foot. 2635 W 4100 S is a home located in Weber County with nearby schools including Midland School, Sand Ridge Junior High School, and Roy High School.
Ownership History
Date
Name
Owned For
Owner Type
Purchase Details
Closed on
Feb 9, 2015
Sold by
Mifflin Robert A
Bought by
Amer Homes 4 Rent Properties Nine Llc
Current Estimated Value
Purchase Details
Closed on
Aug 1, 2006
Sold by
Jackson Travis S and Jackson Amy M
Bought by
Mifflin Robert A
Purchase Details
Closed on
Sep 23, 2004
Sold by
Jackson Travis S and Horwitz Amy M
Bought by
Jackson Travis S
Home Financials for this Owner
Home Financials are based on the most recent Mortgage that was taken out on this home.
Original Mortgage
$127,109
Interest Rate
5.76%
Mortgage Type
FHA
Purchase Details
Closed on
Sep 5, 2002
Sold by
Nilson & Company Inc
Bought by
Jackson Travis S
Home Financials for this Owner
Home Financials are based on the most recent Mortgage that was taken out on this home.
Original Mortgage
$126,022
Interest Rate
6.29%
Mortgage Type
FHA
Create a Home Valuation Report for This Property
The Home Valuation Report is an in-depth analysis detailing your home's value as well as a comparison with similar homes in the area
Home Values in the Area
Average Home Value in this Area
Purchase History
| Date | Buyer | Sale Price | Title Company |
|---|---|---|---|
| Amer Homes 4 Rent Properties Nine Llc | -- | Inwest Title Svcs Salt Lake | |
| Mifflin Robert A | -- | None Available | |
| Jackson Travis S | -- | -- | |
| Jackson Travis S | -- | Bonneville Title |
Source: Public Records
Mortgage History
| Date | Status | Borrower | Loan Amount |
|---|---|---|---|
| Previous Owner | Jackson Travis S | $127,109 | |
| Previous Owner | Jackson Travis S | $126,022 |
Source: Public Records
Tax History
| Year | Tax Paid | Tax Assessment Tax Assessment Total Assessment is a certain percentage of the fair market value that is determined by local assessors to be the total taxable value of land and additions on the property. | Land | Improvement |
|---|---|---|---|---|
| 2025 | $2,681 | $426,140 | $135,986 | $290,154 |
| 2024 | $2,561 | $409,000 | $135,012 | $273,988 |
| 2023 | $2,498 | $400,000 | $129,667 | $270,333 |
| 2022 | $2,804 | $467,000 | $110,001 | $356,999 |
| 2021 | $2,185 | $327,000 | $75,002 | $251,998 |
| 2020 | $2,125 | $293,000 | $75,002 | $217,998 |
| 2019 | $2,121 | $276,000 | $49,906 | $226,094 |
| 2018 | $1,944 | $237,000 | $44,976 | $192,024 |
| 2017 | $1,824 | $208,000 | $43,029 | $164,971 |
| 2016 | $1,761 | $107,998 | $24,773 | $83,225 |
| 2015 | $1,554 | $96,857 | $24,773 | $72,084 |
| 2014 | $1,384 | $84,011 | $21,944 | $62,067 |
Source: Public Records
Map
Nearby Homes
- 2778 W 4175 S Unit 237
- 4297 Westlake Dr
- 4248 S 2400 W
- 2815 W 4275 S
- 3860 S Midland Dr Unit B 51
- 4270 S 2900 W
- 4374 S 2900 W
- 3750 S Midland Dr Unit 80
- 3750 S Midland Dr Unit 189
- 3750 S Midland Dr
- 3750 S Midland Dr Unit 34
- 3750 Midland Dr
- 3750 Midland Dr Unit 169
- 3860 Midland Dr Unit C10
- 3860 Midland Dr Unit C39
- 3860 Midland Dr Unit A18
- 3860 Midland Dr Unit B32
- 3860 Midland Dr Unit C62
- 2979 W 4275 S
- 4061 S 2175 W
- 2645 W 4100 S
- 4143 Westlake Dr
- 2653 W 4100 S
- 4121 Westlake Dr
- 4149 Westlake Dr
- 4116 S 2650 W
- 2638 W 4100 S
- 2646 W 4100 S
- 2628 W 4100 S
- 4121 S 2650 W
- 2620 W 4100 S
- 2654 W 4100 S
- 4091 Westlake Dr
- 4163 Westlake Dr
- 4107 S 2650 W
- 4136 Westlake Dr
- 4142 Westlake Dr
- 4115 S 2650 W
- 2662 W 4100 S
- 4148 Westlake Dr
Your Personal Tour Guide
Ask me questions while you tour the home.