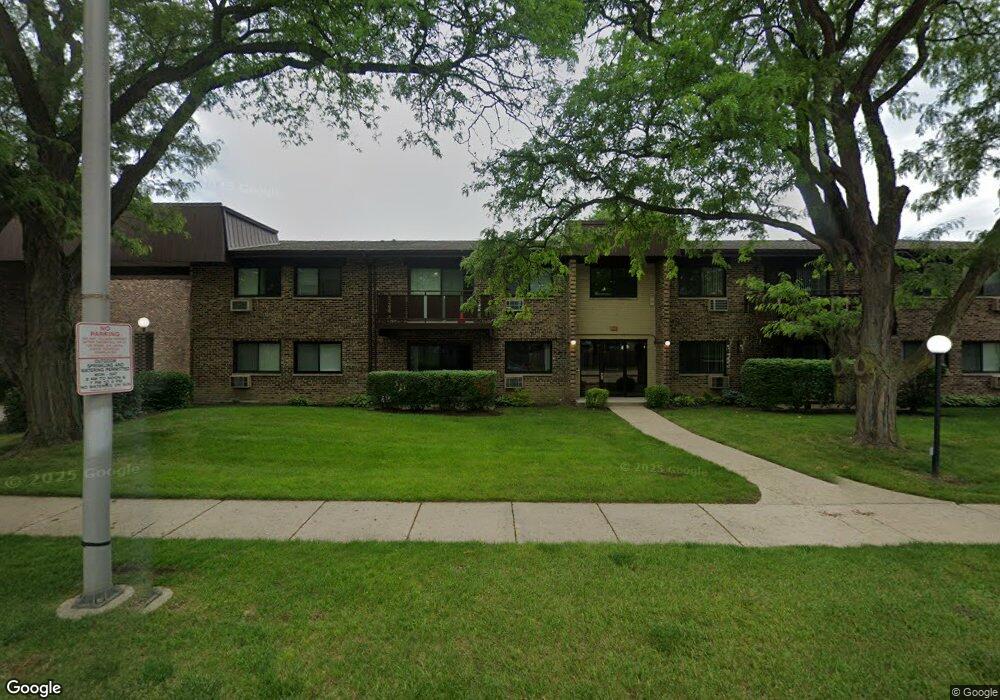
2636 N Windsor Dr Unit 162 Arlington Heights, IL 60004
Estimated Value: $187,000 - $237,000
3
Beds
--
Bath
77,552
Sq Ft
$3/Sq Ft
Est. Value
About This Home
This home is located at 2636 N Windsor Dr Unit 162, Arlington Heights, IL 60004 and is currently estimated at $214,160, approximately $2 per square foot. 2636 N Windsor Dr Unit 162 is a home located in Cook County with nearby schools including Ivy Hill Elementary School, Thomas Middle School, and Buffalo Grove High School.
Ownership History
Date
Name
Owned For
Owner Type
Purchase Details
Closed on
May 11, 2022
Sold by
Gloria Sabbath J and Gloria Ree
Bought by
Shin Eun J
Current Estimated Value
Home Financials for this Owner
Home Financials are based on the most recent Mortgage that was taken out on this home.
Original Mortgage
$133,200
Interest Rate
4.99%
Mortgage Type
New Conventional
Purchase Details
Closed on
May 1, 2022
Sold by
Sabbath Gloria Ree and Sabbath Michael J
Bought by
Sabbath J Michael
Home Financials for this Owner
Home Financials are based on the most recent Mortgage that was taken out on this home.
Original Mortgage
$133,200
Interest Rate
4.99%
Mortgage Type
New Conventional
Purchase Details
Closed on
Feb 25, 2013
Sold by
Ree Sabbath Gloria and Ree Michael Sabbath
Bought by
Sabbath J Michael and Ree Sabath Gloria
Purchase Details
Closed on
May 16, 2002
Sold by
Sabbath J Michael
Bought by
Sabbath J Michael and Ree Sabbath Gloria
Create a Home Valuation Report for This Property
The Home Valuation Report is an in-depth analysis detailing your home's value as well as a comparison with similar homes in the area
Home Values in the Area
Average Home Value in this Area
Purchase History
| Date | Buyer | Sale Price | Title Company |
|---|---|---|---|
| Shin Eun J | $148,000 | None Listed On Document | |
| Sabbath J Michael | -- | None Listed On Document | |
| Sabbath J Michael | -- | None Available | |
| Sabbath J Michael | -- | Chicago Title Insurance Co |
Source: Public Records
Mortgage History
| Date | Status | Borrower | Loan Amount |
|---|---|---|---|
| Previous Owner | Shin Eun J | $133,200 |
Source: Public Records
Tax History Compared to Growth
Tax History
| Year | Tax Paid | Tax Assessment Tax Assessment Total Assessment is a certain percentage of the fair market value that is determined by local assessors to be the total taxable value of land and additions on the property. | Land | Improvement |
|---|---|---|---|---|
| 2024 | $4,677 | $17,085 | $4,149 | $12,936 |
| 2023 | $3,603 | $17,085 | $4,149 | $12,936 |
| 2022 | $3,603 | $17,085 | $4,149 | $12,936 |
| 2021 | $4,141 | $13,755 | $471 | $13,284 |
| 2020 | $4,033 | $13,755 | $471 | $13,284 |
| 2019 | $4,026 | $15,334 | $471 | $14,863 |
| 2018 | $2,956 | $10,129 | $377 | $9,752 |
| 2017 | $2,921 | $10,129 | $377 | $9,752 |
| 2016 | $2,724 | $10,129 | $377 | $9,752 |
| 2015 | $2,757 | $9,337 | $1,791 | $7,546 |
| 2014 | $1,940 | $9,337 | $1,791 | $7,546 |
| 2013 | $2,264 | $10,733 | $1,791 | $8,942 |
Source: Public Records
Map
Nearby Homes
- 2640 N Windsor Dr Unit 102
- 2632 N Windsor Dr Unit 104
- 2604 N Windsor Dr Unit 206
- 2620 N Windsor Dr Unit 201
- 2608 N Wilshire Ln
- 2616 N Prindle Ave
- 1306 E Best Dr
- 1925 E Waverly Ln
- 3023 N Windsor Dr
- 1038 Harbour Ct Unit 2A
- 2143 E Peachtree Ln
- 504 E Sunset Dr
- 1054 Harbour Ct Unit 1A
- 1500 Harbour Dr Unit 1D
- 1500 Harbour Dr Unit 2K
- 671 Cedarwood Ct Unit 2
- 791 Lakeside Circle Dr Unit 1
- 413 Buffalo Trail Unit 10601
- 705 Lakeside Circle Dr Unit 2
- 691 Lakeside Circle Dr
- 2636 N Windsor Dr Unit 203
- 2636 N Windsor Dr Unit 165
- 2636 N Windsor Dr Unit 164
- 2636 N Windsor Dr Unit 161
- 2636 N Windsor Dr Unit 168
- 2636 N Windsor Dr Unit 163
- 2636 N Windsor Dr Unit 167
- 2636 N Windsor Dr Unit 166
- 2636 N Windsor Dr Unit 201
- 2636 N Windsor Dr Unit 104
- 2636 N Windsor Dr Unit 101
- 2636 N Windsor Dr Unit 103
- 2636 N Windsor Dr Unit 202
- 2636 N Windsor Dr Unit 204
- 2642 N Windsor Dr Unit 191
- 2642 N Windsor Dr Unit 187
- 2642 N Windsor Dr Unit 192
- 2642 N Windsor Dr Unit 190
- 2642 N Windsor Dr Unit 186
- 2642 N Windsor Dr Unit 188