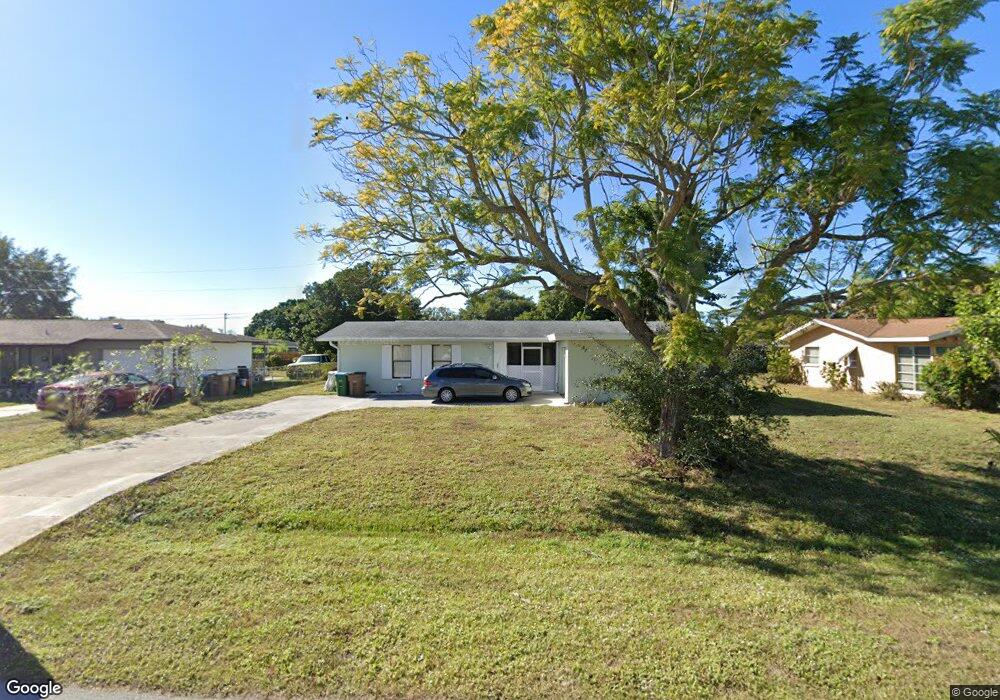
2636 SE 18th Ave Unit 29 Cape Coral, FL 33904
Caloosahatchee NeighborhoodEstimated Value: $245,306 - $340,000
3
Beds
2
Baths
1,242
Sq Ft
$226/Sq Ft
Est. Value
About This Home
This home is located at 2636 SE 18th Ave Unit 29, Cape Coral, FL 33904 and is currently estimated at $280,827, approximately $226 per square foot. 2636 SE 18th Ave Unit 29 is a home located in Lee County with nearby schools including Cape Elementary School, Caloosa Elementary School, and Tropic Isles Elementary School.
Ownership History
Date
Name
Owned For
Owner Type
Purchase Details
Closed on
Oct 31, 2023
Sold by
Colicchia Donato
Bought by
Inzillo Fabian
Current Estimated Value
Home Financials for this Owner
Home Financials are based on the most recent Mortgage that was taken out on this home.
Original Mortgage
$224,000
Outstanding Balance
$219,855
Interest Rate
7.19%
Mortgage Type
New Conventional
Estimated Equity
$60,972
Purchase Details
Closed on
Aug 16, 2021
Sold by
Donato Colicchia
Bought by
Khare Pretty
Purchase Details
Closed on
Oct 29, 2012
Sold by
Desoto Holdings Inc
Bought by
Colicchia Donato
Purchase Details
Closed on
Oct 25, 2012
Sold by
Secretary Of Housing & Urban Development
Bought by
Desoto Holdings Inc
Purchase Details
Closed on
Oct 15, 2010
Sold by
Bac Home Loans Servicing Lp
Bought by
Secretary Of Housing & Urban Development
Purchase Details
Closed on
Sep 24, 2010
Sold by
Downing Daniel
Bought by
Bac Home Loans Servicing Lp and Countrywide Home Loans Servicing Lp
Purchase Details
Closed on
May 11, 2004
Sold by
Downing Carol and Downing Daniel
Bought by
Downing Daniel
Create a Home Valuation Report for This Property
The Home Valuation Report is an in-depth analysis detailing your home's value as well as a comparison with similar homes in the area
Home Values in the Area
Average Home Value in this Area
Purchase History
| Date | Buyer | Sale Price | Title Company |
|---|---|---|---|
| Inzillo Fabian | $280,000 | Crossroads Title | |
| Khare Pretty | $31,000 | Safe Harbor Title | |
| Colicchia Donato | $54,900 | Equity National Title Llc | |
| Desoto Holdings Inc | $51,000 | Island Title Services Inc | |
| Secretary Of Housing & Urban Development | -- | Attorney | |
| Bac Home Loans Servicing Lp | -- | None Available | |
| Downing Daniel | -- | None Available |
Source: Public Records
Mortgage History
| Date | Status | Borrower | Loan Amount |
|---|---|---|---|
| Open | Inzillo Fabian | $224,000 |
Source: Public Records
Tax History Compared to Growth
Tax History
| Year | Tax Paid | Tax Assessment Tax Assessment Total Assessment is a certain percentage of the fair market value that is determined by local assessors to be the total taxable value of land and additions on the property. | Land | Improvement |
|---|---|---|---|---|
| 2025 | $4,168 | $230,516 | $128,393 | $96,240 |
| 2024 | $4,168 | $213,320 | $83,173 | $130,147 |
| 2023 | $1,524 | $119,877 | $0 | $0 |
| 2022 | $1,346 | $116,385 | $0 | $0 |
| 2021 | $1,257 | $132,586 | $45,000 | $87,586 |
| 2020 | $1,229 | $111,435 | $42,000 | $69,435 |
| 2019 | $1,232 | $112,237 | $42,000 | $70,237 |
| 2018 | $2,215 | $107,396 | $40,000 | $67,396 |
| 2017 | $2,193 | $116,278 | $30,000 | $86,278 |
| 2016 | $2,024 | $103,455 | $30,000 | $73,455 |
| 2015 | $1,893 | $94,502 | $28,300 | $66,202 |
| 2014 | -- | $78,092 | $23,300 | $54,792 |
| 2013 | -- | $53,260 | $12,600 | $40,660 |
Source: Public Records
Map
Nearby Homes
- 2709 SE 17th Place
- 2717 SE 17th Place
- 2705 SE 17th Ave
- 2705 SE 18th Place
- 2619 SE 17th Ave
- 2723 SE 16th Place
- 2635 SE 19th Ave
- 1906 SE 26th St
- 2526 SE 16th Place Unit 108
- 2526 SE 16th Place Unit 105
- 1921 SE 26th Terrace
- 2529 SE 19th Ave
- 1741 SE 29th Ln
- 2515 SE 19th Ave
- 2504 SE 16th Place Unit 101
- 1935 SE 26th St
- 2907 Del Prado Blvd S Unit B7
- 1805 Cornwallis Pkwy Unit 20
- 2003 SE 26th Terrace
- 1903 Cornwallis Pkwy
- 2636 SE 18th Ave
- 2632 SE 18th Ave
- 2702 SE 18th Ave
- 2637 SE 17th Place
- 2631 SE 17th Place
- 2628 SE 18th Ave
- 2706 SE 18th Ave
- 2706 SE 18th Ave
- 2635 SE 18th Ave
- 2705 SE 17th Place
- 2701 SE 18th Ave
- 2627 SE 17th Place
- 2624 SE 18th Ave
- 2705 SE 18th Ave
- 2705 SE 18 Ave
- 2710 SE 18th Ave
- 2627 SE 18th Ave
- 2623 SE 17th Place
- 2709 SE 18th Ave
- 2623 SE 18th Ave