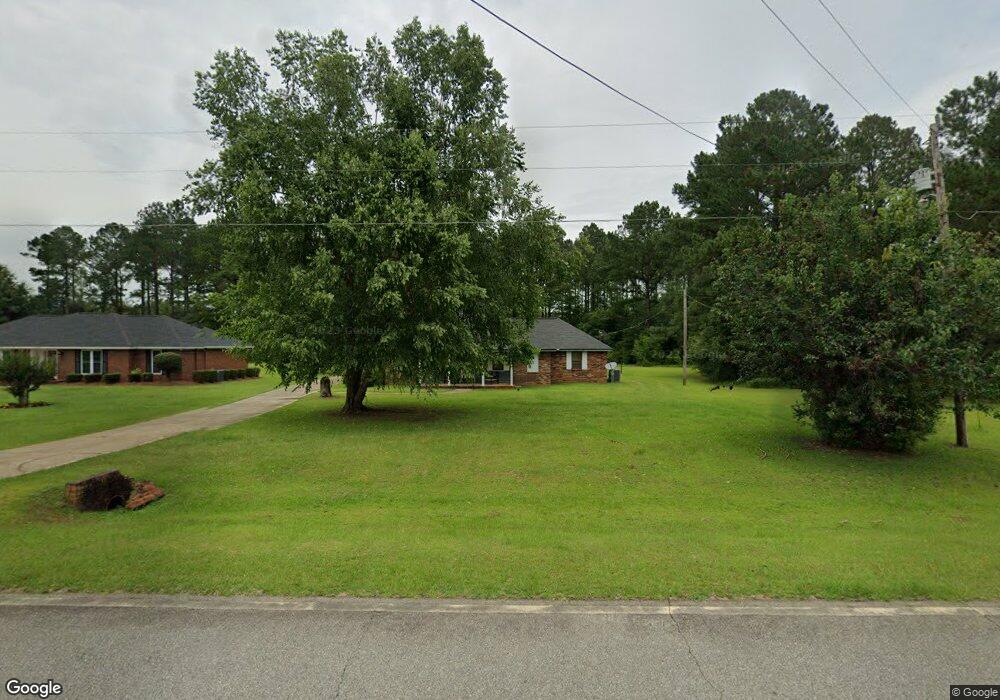
2637 Lonesome Rd Albany, GA 31721
Estimated Value: $114,000 - $207,000
3
Beds
2
Baths
1,469
Sq Ft
$95/Sq Ft
Est. Value
About This Home
This home is located at 2637 Lonesome Rd, Albany, GA 31721 and is currently estimated at $139,227, approximately $94 per square foot. 2637 Lonesome Rd is a home located in Dougherty County with nearby schools including Martin Luther King Jr. Elementary School, Southside Middle School, and Monroe High School.
Ownership History
Date
Name
Owned For
Owner Type
Purchase Details
Closed on
Jun 14, 2024
Sold by
Adams Seneca
Bought by
Clark Freddie and Clark Shirlene
Current Estimated Value
Purchase Details
Closed on
Sep 16, 2009
Sold by
Secretary Of Housing & Urban Development
Bought by
Adams Seneca
Purchase Details
Closed on
Nov 4, 2008
Sold by
Daniels Terry J
Bought by
Citimortgage Inc
Purchase Details
Closed on
Oct 13, 1999
Sold by
Pnc Mtge Corp Of America Fka Sears Mtge
Bought by
Daniels Terry J
Purchase Details
Closed on
Nov 3, 1998
Sold by
Brown Allison M & Mark A By Atty In Fact
Bought by
Pnc Mtge Corp Of America Fka Sears Mtge
Purchase Details
Closed on
Mar 12, 1992
Sold by
Standard Homes Of Al
Bought by
Brown Allison M and Brown A
Purchase Details
Closed on
Jan 25, 1990
Sold by
Miles Clinton Etal
Bought by
Standard Homes Of Al
Create a Home Valuation Report for This Property
The Home Valuation Report is an in-depth analysis detailing your home's value as well as a comparison with similar homes in the area
Home Values in the Area
Average Home Value in this Area
Purchase History
| Date | Buyer | Sale Price | Title Company |
|---|---|---|---|
| Clark Freddie | $105,000 | -- | |
| Adams Seneca | $65,000 | -- | |
| Citimortgage Inc | $95,200 | -- | |
| Secretary Department Of Housing & Urban | $95,244 | -- | |
| Citimortgage Inc | $95,244 | -- | |
| Daniels Terry J | $69,200 | -- | |
| Pnc Mtge Corp Of America Fka Sears Mtge | $56,400 | -- | |
| Brown Allison M | $57,500 | -- | |
| Standard Homes Of Al | $5,000 | -- |
Source: Public Records
Tax History Compared to Growth
Tax History
| Year | Tax Paid | Tax Assessment Tax Assessment Total Assessment is a certain percentage of the fair market value that is determined by local assessors to be the total taxable value of land and additions on the property. | Land | Improvement |
|---|---|---|---|---|
| 2024 | $1,566 | $33,892 | $4,320 | $29,572 |
| 2023 | $1,567 | $33,892 | $4,320 | $29,572 |
| 2022 | $1,570 | $33,892 | $4,320 | $29,572 |
| 2021 | $1,454 | $33,892 | $4,320 | $29,572 |
| 2020 | $1,456 | $33,892 | $4,320 | $29,572 |
| 2019 | $1,460 | $33,892 | $4,320 | $29,572 |
| 2018 | $1,463 | $33,892 | $4,320 | $29,572 |
| 2017 | $1,362 | $33,892 | $4,320 | $29,572 |
| 2016 | $1,363 | $33,892 | $4,320 | $29,572 |
| 2015 | $1,365 | $33,892 | $4,320 | $29,572 |
| 2014 | $1,346 | $33,892 | $4,320 | $29,572 |
Source: Public Records
Map
Nearby Homes
- 6224 Newton Rd
- 2613 Lonesome Rd
- 2610 North Ave
- 5902 Woodcliff St
- 6413 Newton Rd
- 0000 Hamilton Dr
- 3108 Higgins Dr
- 3610 Slade Ave
- 3710 Coakley Ave
- 2206 Willingham Dr
- 1610 Lily Pond Rd
- 5618 Newton Rd
- 5616 Newton Rd
- 5404 Paulk Dr
- 2316 Oak Haven Dr
- 000 Lily Pond Rd
- 1503 Lily Pond Rd
- 1110 Kreg Ave
- 2101 Goldendale Ln
- 2307 Evergreen Dr
- 2639 Lonesome Rd
- 2633 Lonesome Rd
- 2641 Lonesome Rd
- 2631 Lonesome Rd
- 2643 Lonesome Rd
- 2638 Lonesome Rd
- 2629 Lonesome Rd
- 2627 Lonesome Rd
- 2646 Lonesome Rd
- 2625 Lonesome Rd
- 6112 Newton Rd
- 2623 Lonesome Rd
- 2624 Lonesome Rd
- 2621 Lonesome Rd
- 2619 Lonesome Rd
- 2622 Lonesome Rd
- 2703 Lonesome Rd
- 6108 Newton Rd
- 6210 Newton Rd
- 2617 Lonesome Rd