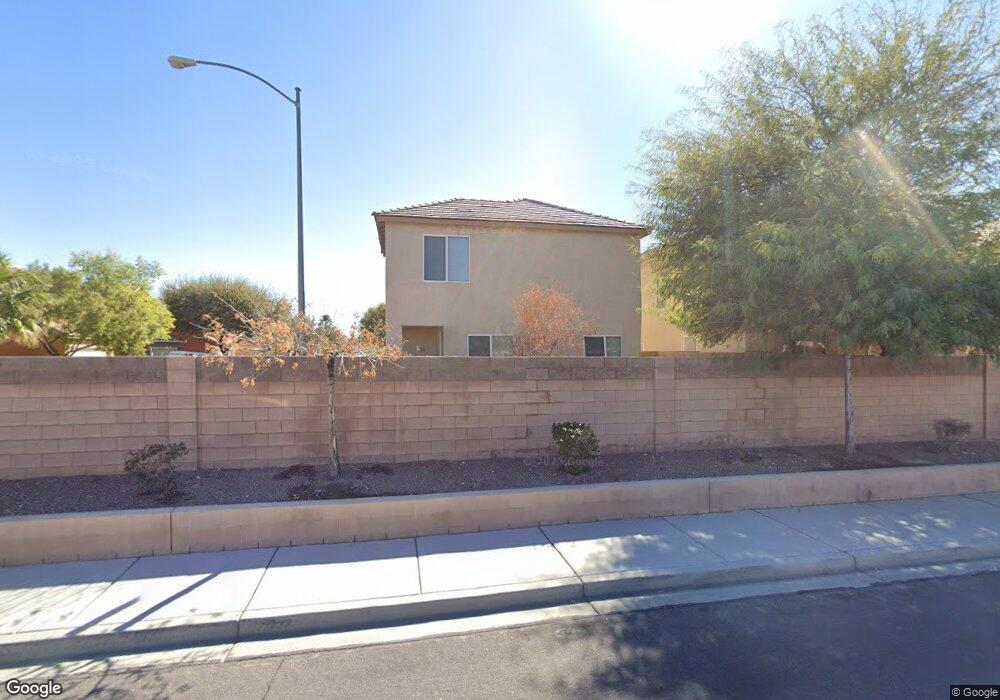
2637 Los Palos St Unit 1A Las Vegas, NV 89108
Michael Way NeighborhoodEstimated Value: $383,000 - $406,000
3
Beds
3
Baths
1,857
Sq Ft
$212/Sq Ft
Est. Value
About This Home
This home is located at 2637 Los Palos St Unit 1A, Las Vegas, NV 89108 and is currently estimated at $393,812, approximately $212 per square foot. 2637 Los Palos St Unit 1A is a home located in Clark County with nearby schools including Doris M. Reed Elementary School, J. Harold Brinley Middle School, and Cimarron Memorial High School.
Ownership History
Date
Name
Owned For
Owner Type
Purchase Details
Closed on
Apr 16, 2024
Sold by
Rodriguez Jaime M and Rodriguez Alicia
Bought by
Jaime & Alicia Trust and Rodriguez
Current Estimated Value
Purchase Details
Closed on
Apr 30, 2004
Sold by
Paige Maryanna
Bought by
Pham Phuong Lien
Home Financials for this Owner
Home Financials are based on the most recent Mortgage that was taken out on this home.
Original Mortgage
$221,800
Interest Rate
5.99%
Mortgage Type
Unknown
Purchase Details
Closed on
Aug 15, 2003
Sold by
Plaster Development Co Inc
Bought by
Rodriguez Jaime M and Rodriguez Alicia
Home Financials for this Owner
Home Financials are based on the most recent Mortgage that was taken out on this home.
Original Mortgage
$171,027
Interest Rate
5.29%
Mortgage Type
FHA
Create a Home Valuation Report for This Property
The Home Valuation Report is an in-depth analysis detailing your home's value as well as a comparison with similar homes in the area
Home Values in the Area
Average Home Value in this Area
Purchase History
| Date | Buyer | Sale Price | Title Company |
|---|---|---|---|
| Jaime & Alicia Trust | -- | None Listed On Document | |
| Pham Phuong Lien | $233,500 | Fidelity National Title | |
| Rodriguez Jaime M | $173,990 | Stewart Title Of Nevada |
Source: Public Records
Mortgage History
| Date | Status | Borrower | Loan Amount |
|---|---|---|---|
| Previous Owner | Pham Phuong Lien | $221,800 | |
| Previous Owner | Rodriguez Jaime M | $171,027 |
Source: Public Records
Tax History Compared to Growth
Tax History
| Year | Tax Paid | Tax Assessment Tax Assessment Total Assessment is a certain percentage of the fair market value that is determined by local assessors to be the total taxable value of land and additions on the property. | Land | Improvement |
|---|---|---|---|---|
| 2025 | $1,249 | $97,041 | $26,950 | $70,091 |
| 2024 | $1,213 | $97,041 | $26,950 | $70,091 |
| 2023 | $1,213 | $93,101 | $26,950 | $66,151 |
| 2022 | $1,178 | $82,694 | $22,400 | $60,294 |
| 2021 | $1,144 | $78,346 | $21,000 | $57,346 |
| 2020 | $1,108 | $76,466 | $19,600 | $56,866 |
| 2019 | $1,094 | $72,769 | $16,800 | $55,969 |
| 2018 | $1,044 | $65,962 | $12,600 | $53,362 |
| 2017 | $1,939 | $59,139 | $12,250 | $46,889 |
| 2016 | $978 | $54,433 | $9,100 | $45,333 |
| 2015 | $976 | $46,740 | $4,200 | $42,540 |
| 2014 | $947 | $28,027 | $4,200 | $23,827 |
Source: Public Records
Map
Nearby Homes
- 5113 Mambo Vista Ave
- 5066 El Castano Ave
- 2601 La Mata St
- 5041 Sublight Ave
- 2753 Stargate St
- 5401 Bugle Way Unit 103
- 2760 Stargate St
- 5401 Geneive Ln Unit 101
- 5400 Tassara Way Unit 102
- 5400 Tassara Way Unit 101
- 5424 Geneive Ln Unit 105
- 5424 Geneive Ln Unit 101
- 5486 Alfred Dr
- 5537 Cleary Ct
- 2829 N Michael Way
- 3300 Michael Way
- 2334 N Michael Way
- 2913 N Michael Way
- 5500 Avenida Vaquero
- 5710 Madre Mesa Dr
- 2633 Los Palos St
- 5189 Loma Verde Ave
- 2629 Los Palos St Unit none
- 2629 Los Palos St
- 2629 Los Palos St
- 5184 Loma Verde Ave
- 5180 Loma Verde Ave
- 5188 Loma Verde Ave
- 2625 Los Palos St
- 2636 Los Palos St
- 2640 Los Palos St
- 5192 Loma Verde Ave
- 2644 Los Palos St
- 2632 Los Palos St
- 2648 Los Palos St
- 2621 Los Palos St
- 2628 Los Palos St
- 2652 Los Palos St
- 2624 Los Palos St
- 2617 Los Palos St