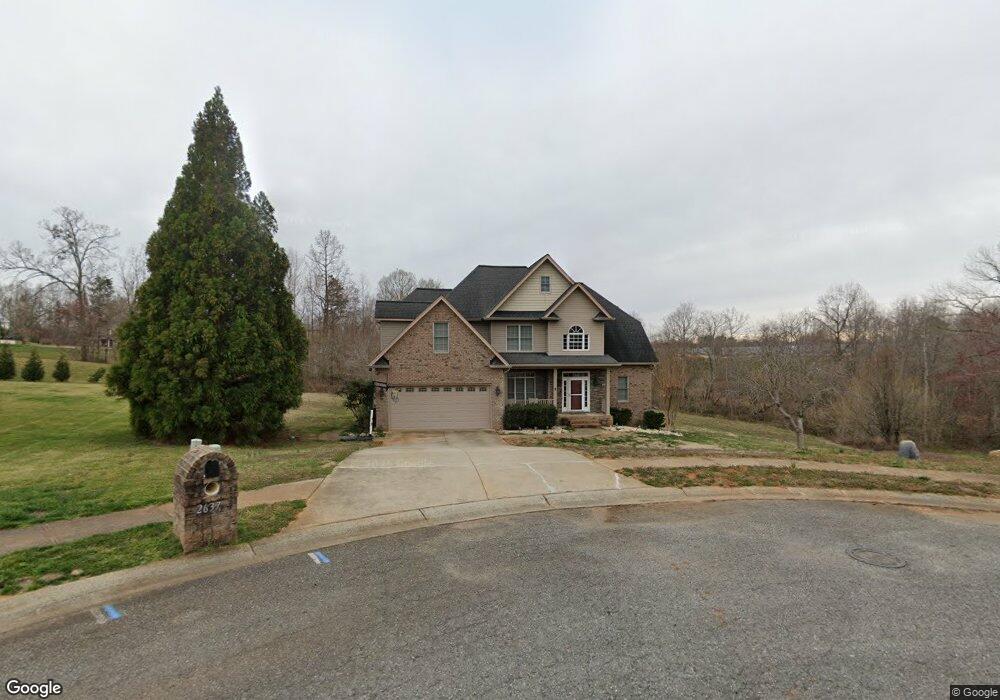
2637 Pamlico Dr Shelby, NC 28152
Estimated Value: $558,000 - $752,000
4
Beds
4
Baths
3,807
Sq Ft
$166/Sq Ft
Est. Value
About This Home
This home is located at 2637 Pamlico Dr, Shelby, NC 28152 and is currently estimated at $632,703, approximately $166 per square foot. 2637 Pamlico Dr is a home located in Cleveland County with nearby schools including Frayser Achievement Elementary School, Springmore Elementary School, and Crest Middle School.
Ownership History
Date
Name
Owned For
Owner Type
Purchase Details
Closed on
May 7, 2025
Sold by
Childers Rebecca Beam
Bought by
Stagecoach Investments Llc
Current Estimated Value
Purchase Details
Closed on
Aug 27, 2015
Sold by
Watterson Thomas A and Watterson Debra A
Bought by
Bostwick John W and Bostwick Kandy
Home Financials for this Owner
Home Financials are based on the most recent Mortgage that was taken out on this home.
Original Mortgage
$355,750
Interest Rate
4.16%
Mortgage Type
New Conventional
Purchase Details
Closed on
Nov 7, 2007
Sold by
Stizel Development Corp
Bought by
Watterson Thomas A and Watterson Debra A
Home Financials for this Owner
Home Financials are based on the most recent Mortgage that was taken out on this home.
Original Mortgage
$237,500
Interest Rate
6.37%
Mortgage Type
New Conventional
Create a Home Valuation Report for This Property
The Home Valuation Report is an in-depth analysis detailing your home's value as well as a comparison with similar homes in the area
Home Values in the Area
Average Home Value in this Area
Purchase History
| Date | Buyer | Sale Price | Title Company |
|---|---|---|---|
| Stagecoach Investments Llc | $265,000 | None Listed On Document | |
| Bostwick John W | $374,500 | None Available | |
| Watterson Thomas A | $360,500 | None Available |
Source: Public Records
Mortgage History
| Date | Status | Borrower | Loan Amount |
|---|---|---|---|
| Previous Owner | Bostwick John W | $355,750 | |
| Previous Owner | Watterson Thomas A | $237,500 |
Source: Public Records
Tax History Compared to Growth
Tax History
| Year | Tax Paid | Tax Assessment Tax Assessment Total Assessment is a certain percentage of the fair market value that is determined by local assessors to be the total taxable value of land and additions on the property. | Land | Improvement |
|---|---|---|---|---|
| 2025 | $6,421 | $645,299 | $51,505 | $593,794 |
| 2024 | $5,868 | $484,862 | $28,120 | $456,742 |
| 2023 | $5,838 | $484,862 | $28,120 | $456,742 |
| 2022 | $5,838 | $484,862 | $28,120 | $456,742 |
| 2021 | $5,868 | $484,862 | $28,120 | $456,742 |
| 2020 | $4,864 | $389,699 | $28,120 | $361,579 |
| 2019 | $4,864 | $389,699 | $28,120 | $361,579 |
| 2018 | $4,663 | $373,628 | $28,120 | $345,508 |
| 2017 | $4,546 | $373,628 | $28,120 | $345,508 |
| 2016 | $4,566 | $373,628 | $28,120 | $345,508 |
| 2015 | $3,830 | $329,993 | $24,991 | $305,002 |
| 2014 | $3,830 | $329,993 | $24,991 | $305,002 |
Source: Public Records
Map
Nearby Homes
- 734 Cedar Hill Dr
- 507 Poplar Springs Church Rd
- 340 Beaver Dam Church Rd
- 114 Landon Ct
- 2612 W Dixon Blvd
- 2720 W Dixon Blvd
- 402 Beaver Dam Church Rd
- 113 Plato Lee Rd
- 415 Farmhurst Place
- 6102 Len Dr
- 304 Walkers Ridge Rd
- 336 Webb Farm Rd
- 211 Webb Farm Rd
- 116 & 118 Webb Rd
- 16 Harlans Rd
- 0 Harlans Rd
- 3839 W Dixon Blvd
- 1033 College Ave
- 1313 Dockery Dr Unit 1
- 1311 Dockery Dr
- 2639 Pamlico Dr
- 2635 Pamlico Dr
- 2636 Pamlico Dr
- 2634 Pamlico Dr
- 2633 Pamlico Dr
- 2632 Pamlico Dr
- 736 Cedar Hill Dr
- 730 Cedar Hill Dr
- 737 Cedar Hill Dr Unit 57
- 702 Kensington Ct
- 2631 Pamlico Dr
- 735 Cedar Hill Dr
- 2628 Pebble Creek Dr
- 2632 Pebble Creek
- 2626 Pebble Creek
- 733 Cedar Hill Dr
- 731 Cedar Hill Dr
- 2621 Flagstone Ct
- 2627 Pebble Creek Dr
- 2624 Pebble Creek