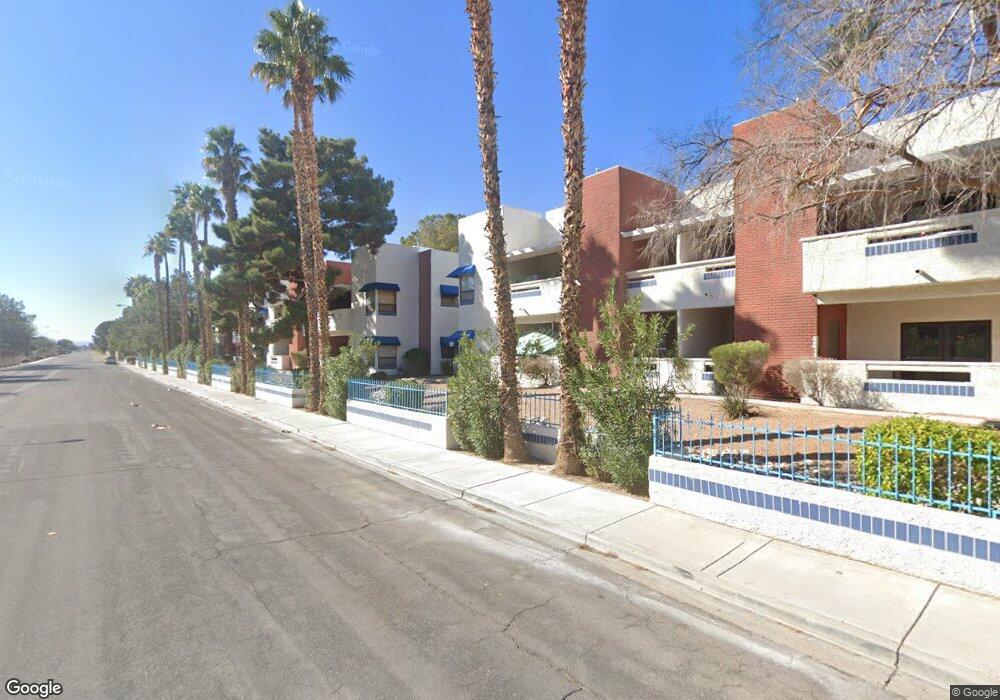
2637 Red Rock St Unit 201 Las Vegas, NV 89146
Estimated Value: $232,347 - $248,000
2
Beds
2
Baths
1,357
Sq Ft
$176/Sq Ft
Est. Value
About This Home
This home is located at 2637 Red Rock St Unit 201, Las Vegas, NV 89146 and is currently estimated at $238,587, approximately $175 per square foot. 2637 Red Rock St Unit 201 is a home located in Clark County with nearby schools including Elaine Wynn Elementary School, Dr. C Owen Roundy Elementary School, and Kenny C Guinn Middle School.
Ownership History
Date
Name
Owned For
Owner Type
Purchase Details
Closed on
Mar 13, 2013
Sold by
Recce Robert A
Bought by
Reece Roberto A
Current Estimated Value
Home Financials for this Owner
Home Financials are based on the most recent Mortgage that was taken out on this home.
Original Mortgage
$73,209
Outstanding Balance
$15,004
Interest Rate
3.49%
Mortgage Type
VA
Estimated Equity
$223,583
Purchase Details
Closed on
Nov 16, 2005
Sold by
Reece Mcclaren Roberto A
Bought by
Reece Roberto A and Roberto A Reece Revocable Living Trust
Purchase Details
Closed on
Apr 12, 2002
Sold by
Dicken Dash Brenda Cheryl and Dash Brenda Cheryl
Bought by
Reece Mcclaren Roberto A
Home Financials for this Owner
Home Financials are based on the most recent Mortgage that was taken out on this home.
Original Mortgage
$91,800
Interest Rate
6.78%
Mortgage Type
VA
Create a Home Valuation Report for This Property
The Home Valuation Report is an in-depth analysis detailing your home's value as well as a comparison with similar homes in the area
Home Values in the Area
Average Home Value in this Area
Purchase History
| Date | Buyer | Sale Price | Title Company |
|---|---|---|---|
| Reece Roberto A | -- | None Available | |
| Reece Roberto A | -- | -- | |
| Reece Mcclaren Roberto A | $90,000 | Pioneer National Title | |
| Dickenson Dash Brenda Cheryl | -- | Pioneer National Title |
Source: Public Records
Mortgage History
| Date | Status | Borrower | Loan Amount |
|---|---|---|---|
| Open | Reece Roberto A | $73,209 | |
| Previous Owner | Reece Mcclaren Roberto A | $91,800 |
Source: Public Records
Tax History Compared to Growth
Tax History
| Year | Tax Paid | Tax Assessment Tax Assessment Total Assessment is a certain percentage of the fair market value that is determined by local assessors to be the total taxable value of land and additions on the property. | Land | Improvement |
|---|---|---|---|---|
| 2025 | $694 | $46,772 | $19,600 | $27,172 |
| 2024 | $709 | $46,772 | $19,600 | $27,172 |
| 2023 | $396 | $47,411 | $21,700 | $25,711 |
| 2022 | $552 | $40,127 | $16,100 | $24,027 |
| 2021 | $511 | $38,961 | $15,400 | $23,561 |
| 2020 | $472 | $38,724 | $15,050 | $23,674 |
| 2019 | $442 | $33,697 | $9,975 | $23,722 |
| 2018 | $422 | $30,731 | $7,350 | $23,381 |
| 2017 | $750 | $25,562 | $5,250 | $20,312 |
| 2016 | $396 | $27,970 | $4,550 | $23,420 |
| 2015 | $394 | $21,045 | $4,550 | $16,495 |
| 2014 | $382 | $19,352 | $3,850 | $15,502 |
Source: Public Records
Map
Nearby Homes
- 2625 Westwind Rd
- 2675 Westwind Rd
- 2885 Duneville St
- 0 S Bronco St
- 2780 El Camino Rd
- 6151 Peppermill Dr
- 5785 Edna Ave
- 5991 Obannon Dr
- 5925 Obannon Dr
- 2216 Verdinal Dr
- 5895 Coley Ave
- 6316 Peppermill Dr
- 0 Palmyra Unit 2715168
- 6320 Peppermill Dr
- 3085 Duneville St
- 2691 Rimpacific Cir
- 2177 Mohawk St
- 3090 Westwind Rd
- 5181 Eldora Ave
- 6325 Stonegate Way
- 2637 Red Rock St Unit 101
- 2637 Red Rock St Unit 102
- 2625 Red Rock St Unit 202
- 2625 Red Rock St Unit 201
- 2625 Red Rock St Unit 102
- 2625 Red Rock St Unit 101
- 2619 Red Rock St Unit 101
- 2619 Red Rock St Unit 202
- 2619 Red Rock St Unit 102
- 2619 Red Rock St Unit 201
- 2631 Red Rock St Unit 202
- 2631 Red Rock St Unit 102
- 2631 Red Rock St Unit 201
- 2631 Red Rock St Unit 101
- 2643 Red Rock St Unit 101
- 2643 Red Rock St Unit 202
- 2643 Red Rock St Unit 201
- 2643 Red Rock St
- 2649 Red Rock St Unit 101
- 2649 Red Rock St