Estimated Value: $125,000 - $207,000
--
Bed
--
Bath
1,418
Sq Ft
$108/Sq Ft
Est. Value
About This Home
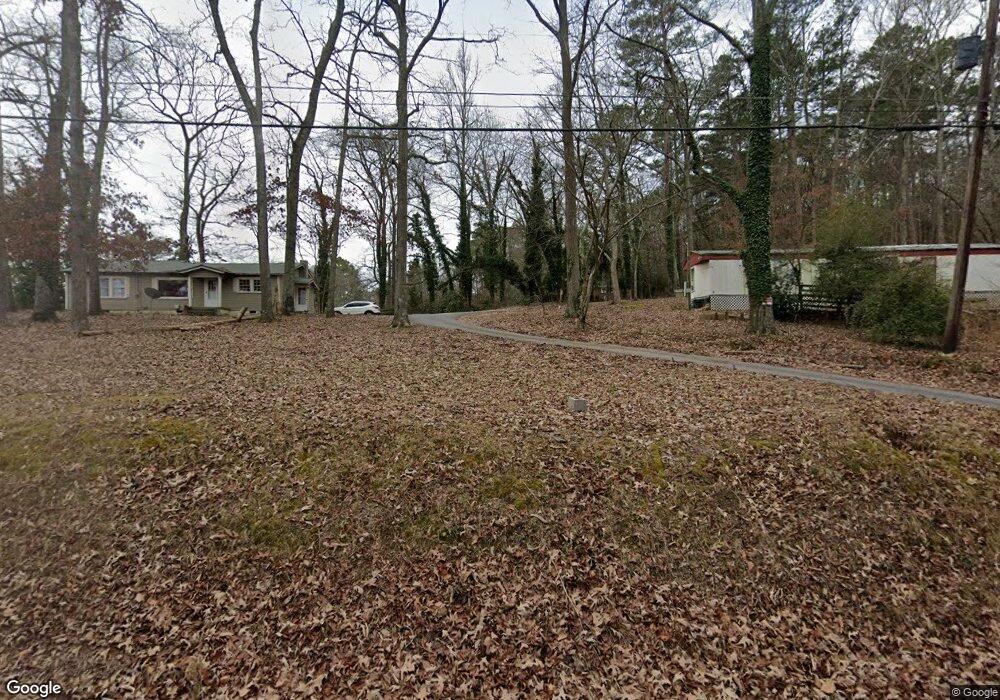
This home is located at 2638 Callier Springs Rd SE, Rome, GA 30161 and is currently estimated at $153,733, approximately $108 per square foot. 2638 Callier Springs Rd SE is a home located in Floyd County with nearby schools including Pepperell Middle School, Pepperell High School, and Montessori School of Rome.
Ownership History
Date
Name
Owned For
Owner Type
Purchase Details
Closed on
Apr 29, 2010
Sold by
Miller Arthur R
Bought by
Spence David C
Current Estimated Value
Purchase Details
Closed on
Jul 31, 2008
Sold by
Not Provided
Bought by
Spence David C
Purchase Details
Closed on
Jul 21, 2008
Sold by
Not Provided
Bought by
Spence David C
Purchase Details
Closed on
May 8, 1986
Sold by
Bagley James Eugene
Bought by
Miller Frances B
Purchase Details
Closed on
Sep 15, 1969
Sold by
Bagley Alfred Tarvin & Jas Eugene Life E
Bought by
Bagley James Eugene
Purchase Details
Closed on
Jan 13, 1969
Sold by
Bagley Jm and Bagley Mattie
Bought by
Bagley Alfred Tarvin and Jas Eugene L
Purchase Details
Closed on
Dec 21, 1964
Sold by
Bagley Imogene and Bagley Jm
Bought by
Bagley Jm and Bagley Mattie
Purchase Details
Closed on
Jan 1, 1901
Bought by
Bagley Imogene and Bagley Jm
Create a Home Valuation Report for This Property
The Home Valuation Report is an in-depth analysis detailing your home's value as well as a comparison with similar homes in the area
Home Values in the Area
Average Home Value in this Area
Purchase History
| Date | Buyer | Sale Price | Title Company |
|---|---|---|---|
| Spence David C | -- | -- | |
| Spence David C | -- | -- | |
| Spence David C | -- | -- | |
| Miller Frances B | $22,500 | -- | |
| Bagley James Eugene | $2,900 | -- | |
| Bagley Alfred Tarvin | -- | -- | |
| Bagley Jm | -- | -- | |
| Bagley Imogene | -- | -- |
Source: Public Records
Tax History Compared to Growth
Tax History
| Year | Tax Paid | Tax Assessment Tax Assessment Total Assessment is a certain percentage of the fair market value that is determined by local assessors to be the total taxable value of land and additions on the property. | Land | Improvement |
|---|---|---|---|---|
| 2024 | $1,070 | $34,242 | $5,105 | $29,137 |
| 2023 | $980 | $32,272 | $4,467 | $27,805 |
| 2022 | $777 | $26,185 | $3,510 | $22,675 |
| 2021 | $649 | $21,516 | $3,191 | $18,325 |
| 2020 | $600 | $19,700 | $2,552 | $17,148 |
| 2019 | $556 | $18,503 | $2,552 | $15,951 |
| 2018 | $511 | $16,976 | $2,552 | $14,424 |
| 2017 | $491 | $16,295 | $2,552 | $13,743 |
| 2016 | $482 | $15,804 | $2,520 | $13,284 |
| 2015 | $483 | $15,804 | $2,520 | $13,284 |
| 2014 | $483 | $16,204 | $2,520 | $13,684 |
Source: Public Records
Map
Nearby Homes
- 74 Dodd Blvd SE
- 93 Dodd Blvd SE
- 95 Dodd Blvd SE
- 145 Mountain View Rd SE
- 1 Joe Louis Blvd SE
- 7 Crestview Ln SE
- 452 Mountain View Rd SE
- 14 Gables Dr SE
- 46 Turnbull Dr SE
- 12 Turnbull Dr SE
- 2512 Callier Springs Rd SE
- 0 Highway 411 SE Unit 7692418
- 0 Highway 411 SE Unit 10657682
- 9 Richland Ct SE
- 13 Townview Rd SE
- 0 Turnbull Dr SE Unit 10570009
- 4 Coach Trail SE
- 1 Vassar Dr SE
- 75 Chateau Dr SE
- 77 Chateau Dr SE
- 13 Pine Park Dr SE
- 2636 Callier Springs Rd SE
- 2536 Callier Springs Rd SE
- 11 Pine Park Dr SE
- 1 Pine Park Dr SE
- 2 Pine Park Dr SE
- 2635 Callier Springs Rd SE
- 9 Pine Park Dr SE
- 4 Pine Park Dr SE
- 3 Pine Park Dr SE
- 8 Pine Park Dr SE
- 8 Pine Park Dr SE
- 2692 Callier Springs Rd SE
- 7 Pine Park Dr SE
- 2653 Callier Springs Rd SE
- 2653 Callier Springs Rd SE
- 24 Dodd Blvd SE Unit 5
- 24 Dodd Blvd SE
- 5 Pine Park Dr SE
- 5 Dodd Blvd SE Unit A&B