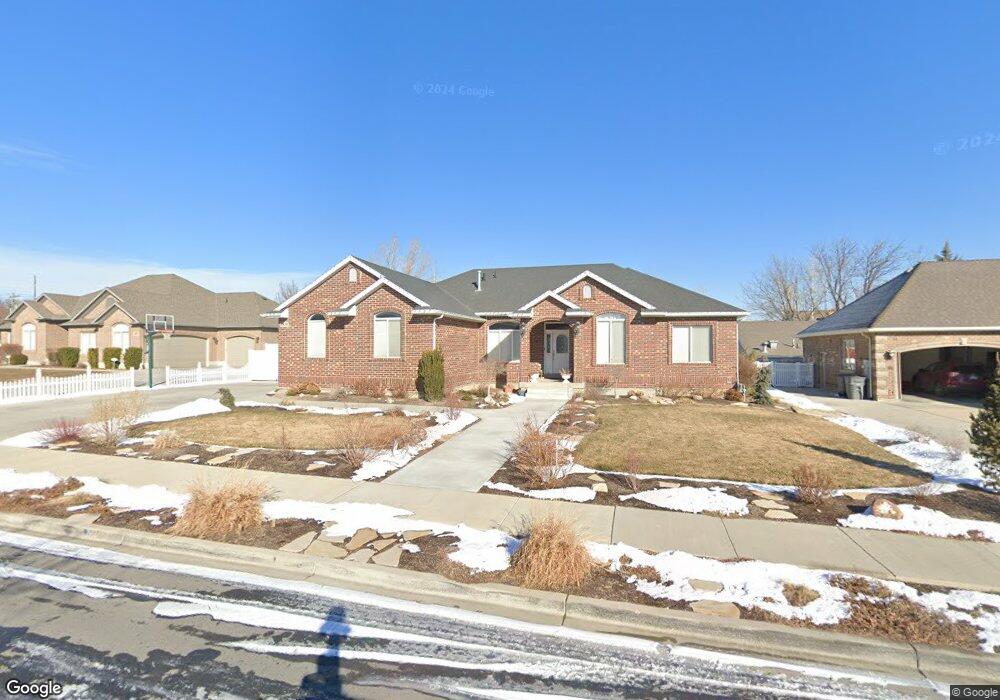
2638 Carriage Oak Ct South Jordan, UT 84095
Estimated Value: $764,000 - $950,000
5
Beds
4
Baths
4,042
Sq Ft
$213/Sq Ft
Est. Value
About This Home
This home is located at 2638 Carriage Oak Ct, South Jordan, UT 84095 and is currently estimated at $861,554, approximately $213 per square foot. 2638 Carriage Oak Ct is a home located in Salt Lake County with nearby schools including Jordan Ridge School, South Jordan Middle School, and Hawthorn Academy.
Ownership History
Date
Name
Owned For
Owner Type
Purchase Details
Closed on
Apr 28, 2009
Sold by
Knadler Charles E and Knadler Coralee F
Bought by
Spigarelli Steven J and Spigarelli Tressa L
Current Estimated Value
Home Financials for this Owner
Home Financials are based on the most recent Mortgage that was taken out on this home.
Original Mortgage
$323,200
Outstanding Balance
$205,740
Interest Rate
4.99%
Mortgage Type
Purchase Money Mortgage
Estimated Equity
$655,814
Purchase Details
Closed on
Jun 24, 2004
Sold by
Bangerter Homes Llc
Bought by
Knadler Charles E and Knadler Coralee F
Home Financials for this Owner
Home Financials are based on the most recent Mortgage that was taken out on this home.
Original Mortgage
$222,000
Interest Rate
6.29%
Mortgage Type
Purchase Money Mortgage
Purchase Details
Closed on
Feb 7, 2003
Sold by
Nhb Family Partners Llc
Bought by
Bangerter Homes Llc
Home Financials for this Owner
Home Financials are based on the most recent Mortgage that was taken out on this home.
Original Mortgage
$246,400
Interest Rate
5.62%
Mortgage Type
Construction
Create a Home Valuation Report for This Property
The Home Valuation Report is an in-depth analysis detailing your home's value as well as a comparison with similar homes in the area
Home Values in the Area
Average Home Value in this Area
Purchase History
| Date | Buyer | Sale Price | Title Company |
|---|---|---|---|
| Spigarelli Steven J | -- | Highland Title Agency | |
| Knadler Charles E | -- | Merrill Title | |
| Bangerter Homes Llc | -- | Merrill Title |
Source: Public Records
Mortgage History
| Date | Status | Borrower | Loan Amount |
|---|---|---|---|
| Open | Spigarelli Steven J | $323,200 | |
| Previous Owner | Knadler Charles E | $222,000 | |
| Previous Owner | Bangerter Homes Llc | $246,400 |
Source: Public Records
Tax History Compared to Growth
Tax History
| Year | Tax Paid | Tax Assessment Tax Assessment Total Assessment is a certain percentage of the fair market value that is determined by local assessors to be the total taxable value of land and additions on the property. | Land | Improvement |
|---|---|---|---|---|
| 2025 | $4,111 | $855,300 | $301,800 | $553,500 |
| 2024 | $4,111 | $780,500 | $282,200 | $498,300 |
| 2023 | $4,178 | $748,400 | $276,700 | $471,700 |
| 2022 | $4,365 | $766,400 | $271,300 | $495,100 |
| 2021 | $3,660 | $589,700 | $222,400 | $367,300 |
| 2020 | $3,457 | $522,100 | $208,300 | $313,800 |
| 2019 | $3,479 | $516,400 | $208,300 | $308,100 |
| 2018 | $0 | $487,000 | $136,200 | $350,800 |
| 2017 | $3,173 | $459,300 | $136,200 | $323,100 |
| 2016 | $3,131 | $429,500 | $136,200 | $293,300 |
| 2015 | $3,129 | $417,300 | $149,100 | $268,200 |
| 2014 | $2,935 | $384,600 | $138,800 | $245,800 |
Source: Public Records
Map
Nearby Homes
- 2551 W Winding Way
- 2439 Bridle Oak Dr
- 2375 Bonanza Way
- 2246 Country Bend Dr Unit 25
- 2554 Cherry Grove Way
- 10177 Statesman Place
- 10320 S 2700 W
- 1558 W Banner Dr Unit 805
- 1574 W Banner Dr Unit 743
- 1556 W Banner Dr Unit 806
- 1548 W Banner Dr Unit 809
- 1552 W Banner Dr Unit 807
- 1553 W Banner Dr Unit 844
- 2343 Temple View Cir
- 1967 W 9350 S
- 10366 S 2200 W
- 1891 Orchard View Cir
- 9294 S 2700 W
- 10339 S Cold Moon Place
- 3256 Star Fire Rd
- 2622 Carriage Oak Ct
- 2658 Carriage Oak Ct
- 2637 Winding Way
- 2617 Winding Way
- 2659 Winding Way
- 2659 W Winding Way
- 2602 W Carriage Oak Ct
- 2602 Carriage Oak Ct
- 2647 Carriage Oak Ct
- 2647 W Carriage Oak Ct
- 2627 Carriage Oak Ct
- 2668 W Carriage Oak Ct
- 2668 Carriage Oak Ct
- 2605 Carriage Oak Ct
- 2593 Winding Way
- 2663 Carriage Oak Ct
- 2663 W Carriage Oak Ct
- 12165 S 2660 W Unit 129
- 2681 Winding Way
- 2681 W Winding Way