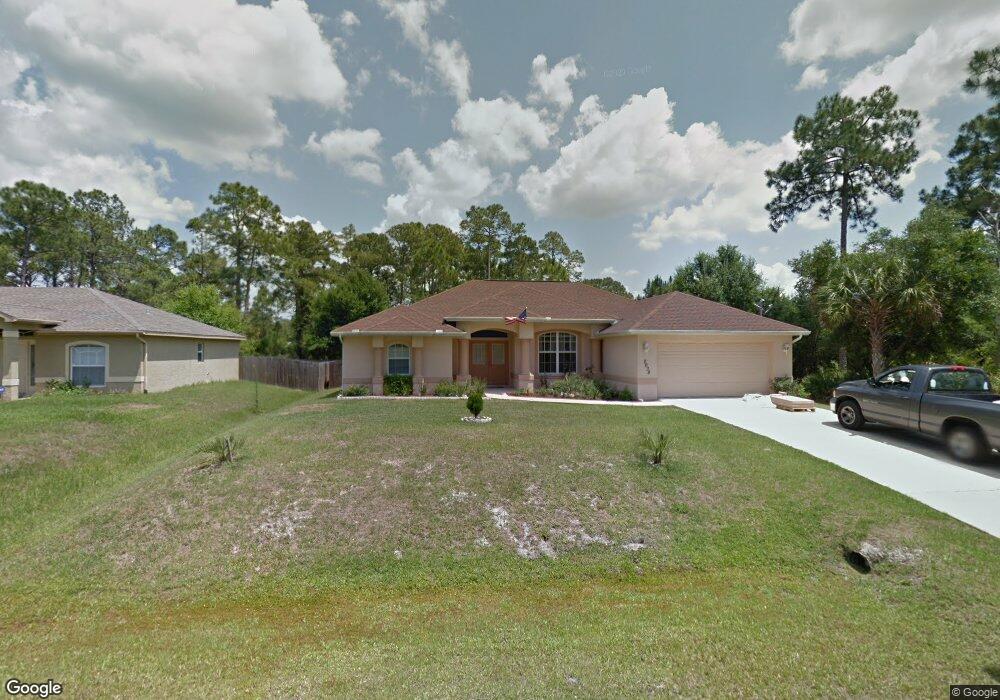
2638 De Garmo St North Port, FL 34291
Estimated Value: $353,964 - $435,000
4
Beds
3
Baths
2,894
Sq Ft
$139/Sq Ft
Est. Value
About This Home
This home is located at 2638 De Garmo St, North Port, FL 34291 and is currently estimated at $401,741, approximately $138 per square foot. 2638 De Garmo St is a home located in Sarasota County with nearby schools including North Port High School, Lamarque Elementary School, and Heron Creek Middle School.
Ownership History
Date
Name
Owned For
Owner Type
Purchase Details
Closed on
Nov 18, 2016
Sold by
Schlipf Gary W
Bought by
Jorge Enrique and Jorge Doris Diane
Current Estimated Value
Home Financials for this Owner
Home Financials are based on the most recent Mortgage that was taken out on this home.
Original Mortgage
$237,590
Outstanding Balance
$191,343
Interest Rate
3.52%
Mortgage Type
VA
Estimated Equity
$210,398
Purchase Details
Closed on
Mar 3, 2005
Sold by
Residential Development Corp
Bought by
Schlipf Gary W
Home Financials for this Owner
Home Financials are based on the most recent Mortgage that was taken out on this home.
Original Mortgage
$139,920
Interest Rate
5.61%
Mortgage Type
Purchase Money Mortgage
Purchase Details
Closed on
Jan 13, 2004
Sold by
Allstate Bldr Sw Fl Inc
Bought by
Hayden George M
Purchase Details
Closed on
Jan 2, 2004
Sold by
Hayden George M
Bought by
Residential Dev Corp
Purchase Details
Closed on
Nov 14, 1994
Sold by
Nationsbank Fl N A
Bought by
Hayden George M and Hayden George M
Create a Home Valuation Report for This Property
The Home Valuation Report is an in-depth analysis detailing your home's value as well as a comparison with similar homes in the area
Home Values in the Area
Average Home Value in this Area
Purchase History
| Date | Buyer | Sale Price | Title Company |
|---|---|---|---|
| Jorge Enrique | $230,000 | Sunbelt Title Agency | |
| Schlipf Gary W | $174,900 | -- | |
| Hayden George M | -- | -- | |
| Residential Dev Corp | $5,000 | -- | |
| Residential Dev Corp | $5,000 | -- | |
| Hayden George M | $5,000 | -- |
Source: Public Records
Mortgage History
| Date | Status | Borrower | Loan Amount |
|---|---|---|---|
| Open | Jorge Enrique | $237,590 | |
| Previous Owner | Schlipf Gary W | $139,920 |
Source: Public Records
Tax History Compared to Growth
Tax History
| Year | Tax Paid | Tax Assessment Tax Assessment Total Assessment is a certain percentage of the fair market value that is determined by local assessors to be the total taxable value of land and additions on the property. | Land | Improvement |
|---|---|---|---|---|
| 2024 | $3,529 | $250,946 | -- | -- |
| 2023 | $3,529 | $221,437 | $0 | $0 |
| 2022 | $3,766 | $237,187 | $0 | $0 |
| 2021 | $3,755 | $230,279 | $0 | $0 |
| 2020 | $3,729 | $227,100 | $7,900 | $219,200 |
| 2019 | $3,709 | $226,900 | $7,100 | $219,800 |
| 2018 | $3,476 | $185,600 | $6,300 | $179,300 |
| 2017 | $3,362 | $177,000 | $4,900 | $172,100 |
| 2016 | $3,138 | $176,600 | $5,100 | $171,500 |
| 2015 | $2,866 | $147,200 | $3,700 | $143,500 |
| 2014 | $2,662 | $107,250 | $0 | $0 |
Source: Public Records
Map
Nearby Homes
- xxx Brenmar Ave
- 0 Adele St
- 0 Granito Ave Unit MFRA4666346
- 0 Granito Ave Unit A4529825
- 00 McTague St
- 0 Kedsie Ave
- 0 Sylvania Ave Unit MFRA4663447
- 0 Cantor Ave Unit MFRA4580410
- Xxx Granito Ave
- 2704 Dooling St
- Lot 8 Cantor Ave
- LOT 9 Cantor Ave
- 2678 Alva St
- 0 Alva St Unit MFRA4653714
- 00 Alva St
- 5458 Jessamine Ave
- 5436 Jessamine Ave
- 0 Jacaranda Ave Unit O6031946
- 0 Burwin Ave Unit MFROM710792
- 5923 Giffen Ave
- 2662 De Garmo St
- 2590 De Garmo St
- 2613 Trianna St
- 2615 De Garmo St
- 0 Trianna St Unit A4411268
- 0 Trianna St Unit MFRT3485663
- 0 Trianna St Unit C7223576
- 0 Trianna St Unit C7223575
- 0 Trianna St Unit T3338137
- 0 Trianna St Unit D5793281
- 0 Trianna St Unit C7419845
- 0 Trianna St Unit C7419841
- 0 Trianna St Unit D6107854
- 2674 Trianna St
- Brenmar Ave
- Brenmar Ave
- Brenmar Ave
- 2692 Trianna St
- 2723 Trianna St
- 2600 Trianna St