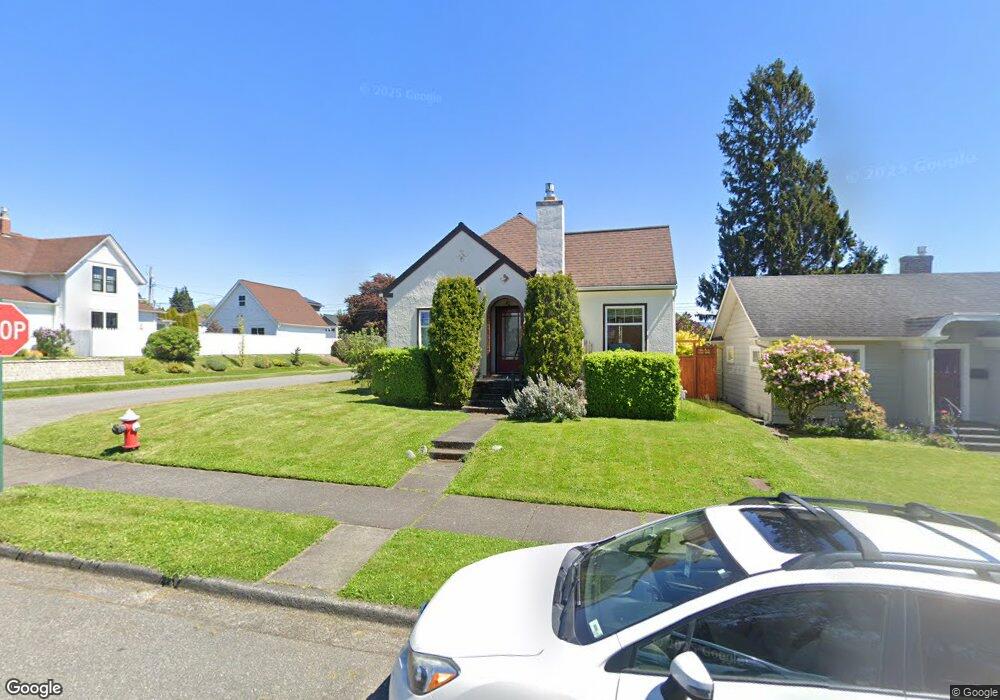
2638 Grant St Bellingham, WA 98225
Sunnyland NeighborhoodEstimated Value: $693,847 - $755,000
3
Beds
1
Bath
1,288
Sq Ft
$558/Sq Ft
Est. Value
About This Home
This home is located at 2638 Grant St, Bellingham, WA 98225 and is currently estimated at $718,462, approximately $557 per square foot. 2638 Grant St is a home located in Whatcom County with nearby schools including Sunnyland Elementary School, Whatcom Middle School, and Bellingham High School.
Ownership History
Date
Name
Owned For
Owner Type
Purchase Details
Closed on
Jan 15, 2022
Sold by
Ernst Nancy R
Bought by
Ernst Nancy R and Bassett Jeff
Current Estimated Value
Home Financials for this Owner
Home Financials are based on the most recent Mortgage that was taken out on this home.
Original Mortgage
$132,200
Interest Rate
3.22%
Mortgage Type
New Conventional
Purchase Details
Closed on
Jan 16, 2008
Sold by
Ernst Nancy R
Bought by
Ernst Nancy R and Bassett Jeffrey A
Purchase Details
Closed on
Sep 12, 2002
Sold by
Lang Jeanne Andry and Grasser Jeanne M
Bought by
Ernst Nancy R
Home Financials for this Owner
Home Financials are based on the most recent Mortgage that was taken out on this home.
Original Mortgage
$75,000
Interest Rate
5.78%
Create a Home Valuation Report for This Property
The Home Valuation Report is an in-depth analysis detailing your home's value as well as a comparison with similar homes in the area
Home Values in the Area
Average Home Value in this Area
Purchase History
| Date | Buyer | Sale Price | Title Company |
|---|---|---|---|
| Ernst Nancy R | -- | Servicelink | |
| Ernst Nancy R | -- | None Available | |
| Ernst Nancy R | $157,000 | Chicago Title Insurance |
Source: Public Records
Mortgage History
| Date | Status | Borrower | Loan Amount |
|---|---|---|---|
| Previous Owner | Ernst Nancy R | $132,200 | |
| Previous Owner | Ernst Nancy R | $75,000 |
Source: Public Records
Tax History Compared to Growth
Tax History
| Year | Tax Paid | Tax Assessment Tax Assessment Total Assessment is a certain percentage of the fair market value that is determined by local assessors to be the total taxable value of land and additions on the property. | Land | Improvement |
|---|---|---|---|---|
| 2024 | $1,505 | $746,390 | $246,304 | $500,086 |
| 2023 | $1,505 | $765,348 | $252,560 | $512,788 |
| 2022 | $769 | $581,807 | $217,728 | $149,780 |
| 2021 | $840 | $461,752 | $172,800 | $149,780 |
| 2020 | $872 | $427,548 | $160,000 | $267,548 |
| 2019 | $534 | $406,897 | $146,406 | $260,491 |
| 2018 | $567 | $365,244 | $131,446 | $233,798 |
| 2017 | $600 | $314,464 | $113,168 | $201,296 |
| 2016 | $596 | $283,535 | $101,552 | $181,983 |
| 2015 | $622 | $258,248 | $92,752 | $165,496 |
| 2014 | -- | $245,017 | $88,000 | $157,017 |
| 2013 | -- | $239,470 | $82,950 | $156,520 |
Source: Public Records
Map
Nearby Homes