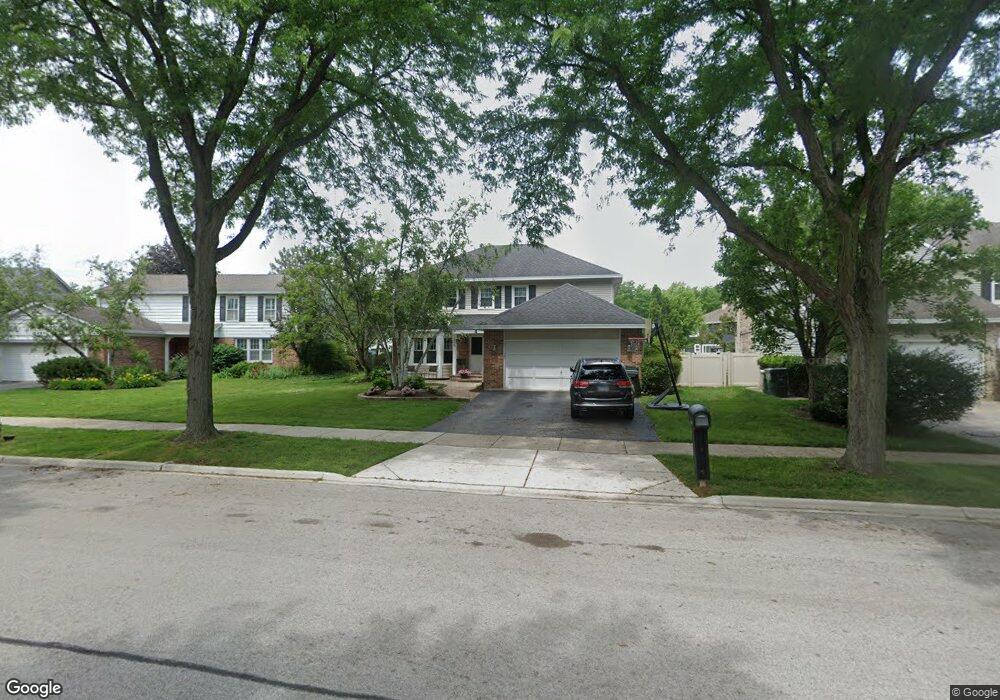
2638 N Stratford Rd Arlington Heights, IL 60004
Estimated Value: $635,118 - $686,000
4
Beds
3
Baths
2,338
Sq Ft
$282/Sq Ft
Est. Value
About This Home
This home is located at 2638 N Stratford Rd, Arlington Heights, IL 60004 and is currently estimated at $658,780, approximately $281 per square foot. 2638 N Stratford Rd is a home located in Cook County with nearby schools including Dwight D Eisenhower Elementary School, Anne Sullivan Elementary School, and Betsy Ross Elementary School.
Ownership History
Date
Name
Owned For
Owner Type
Purchase Details
Closed on
Jun 30, 2004
Sold by
Espinosa Ernesto P and Espinosa Frances
Bought by
Konstantos John K and Konstantos Anastasia
Current Estimated Value
Home Financials for this Owner
Home Financials are based on the most recent Mortgage that was taken out on this home.
Original Mortgage
$333,700
Outstanding Balance
$168,563
Interest Rate
6.39%
Mortgage Type
Unknown
Estimated Equity
$490,217
Purchase Details
Closed on
Nov 14, 2001
Sold by
Espinosa Atenogenesa P
Bought by
Espinosa Ernesto P and Espinosa Frances
Home Financials for this Owner
Home Financials are based on the most recent Mortgage that was taken out on this home.
Original Mortgage
$225,000
Interest Rate
6.62%
Create a Home Valuation Report for This Property
The Home Valuation Report is an in-depth analysis detailing your home's value as well as a comparison with similar homes in the area
Home Values in the Area
Average Home Value in this Area
Purchase History
| Date | Buyer | Sale Price | Title Company |
|---|---|---|---|
| Konstantos John K | $440,000 | Multiple | |
| Espinosa Ernesto P | -- | Chicago Title Insurance Co |
Source: Public Records
Mortgage History
| Date | Status | Borrower | Loan Amount |
|---|---|---|---|
| Open | Konstantos John K | $333,700 | |
| Previous Owner | Espinosa Ernesto P | $225,000 | |
| Closed | Konstantos John K | $18,300 |
Source: Public Records
Tax History Compared to Growth
Tax History
| Year | Tax Paid | Tax Assessment Tax Assessment Total Assessment is a certain percentage of the fair market value that is determined by local assessors to be the total taxable value of land and additions on the property. | Land | Improvement |
|---|---|---|---|---|
| 2024 | $10,574 | $42,000 | $10,459 | $31,541 |
| 2023 | $10,069 | $42,000 | $10,459 | $31,541 |
| 2022 | $10,069 | $42,000 | $10,459 | $31,541 |
| 2021 | $10,508 | $37,900 | $5,942 | $31,958 |
| 2020 | $10,296 | $37,900 | $5,942 | $31,958 |
| 2019 | $10,268 | $42,252 | $5,942 | $36,310 |
| 2018 | $12,000 | $44,648 | $5,229 | $39,419 |
| 2017 | $11,892 | $44,648 | $5,229 | $39,419 |
| 2016 | $11,314 | $44,648 | $5,229 | $39,419 |
| 2015 | $10,055 | $36,457 | $4,516 | $31,941 |
| 2014 | $9,939 | $36,457 | $4,516 | $31,941 |
| 2013 | $9,699 | $36,457 | $4,516 | $31,941 |
Source: Public Records
Map
Nearby Homes
- 2608 N Wilshire Ln
- 2616 N Prindle Ave
- 2632 N Windsor Dr Unit 104
- 1925 E Waverly Ln
- 2640 N Windsor Dr Unit 102
- 2604 N Windsor Dr Unit 206
- 2620 N Windsor Dr Unit 201
- 1038 Harbour Ct Unit 2A
- 2143 E Peachtree Ln
- 1054 Harbour Ct Unit 1A
- 1500 Harbour Dr Unit 1D
- 1500 Harbour Dr Unit 2K
- 791 Lakeside Circle Dr Unit 1
- 671 Cedarwood Ct Unit 2
- 705 Lakeside Circle Dr Unit 2
- 691 Lakeside Circle Dr
- 1306 E Best Dr
- 528 Surf Ct
- 1044 Creekside Ct Unit 2B
- 413 Buffalo Trail Unit 10601
- 2642 N Stratford Rd
- 2634 N Stratford Rd
- 2641 N Wilshire Ln
- 1615 E Canterbury Dr
- 2630 N Stratford Rd
- 2637 N Wilshire Ln
- 2646 N Stratford Rd
- 1609 E Canterbury Dr
- 2633 N Wilshire Ln Unit 9
- 2639 N Stratford Rd
- 2635 N Stratford Rd
- 2641 N Stratford Rd
- 2626 N Stratford Rd
- 2629 N Wilshire Ln
- 2631 N Stratford Rd
- 2645 N Stratford Rd
- 2625 N Wilshire Ln
- 2622 N Stratford Rd
- 2649 N Stratford Rd
- 1515 E Canterbury Dr