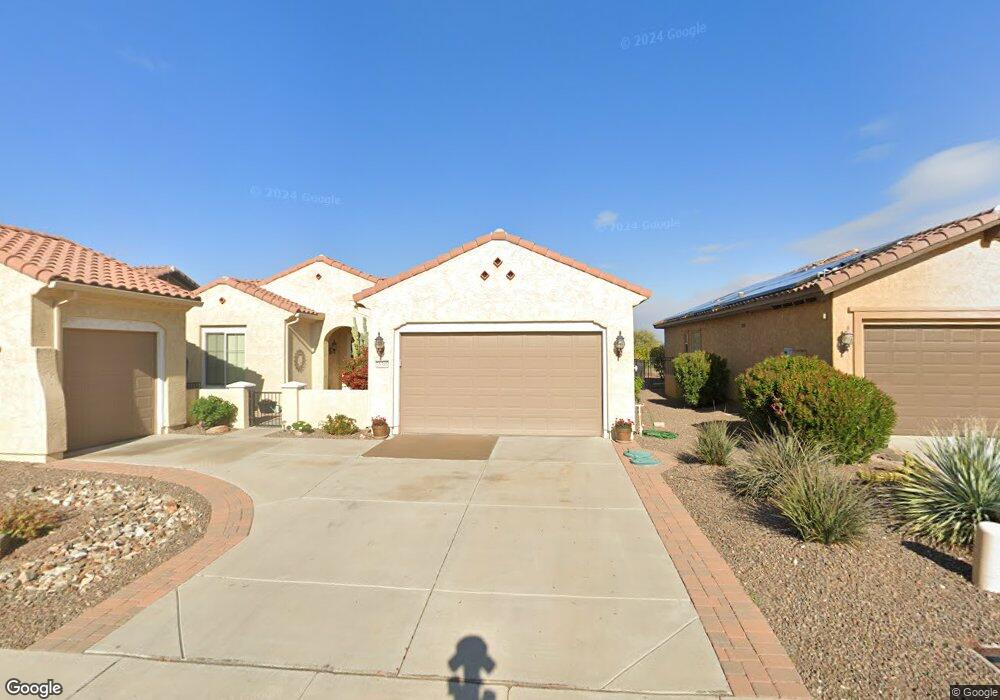
26386 W Runion Ln Buckeye, AZ 85396
Sun City Festival NeighborhoodEstimated Value: $499,000 - $540,236
2
Beds
2
Baths
1,961
Sq Ft
$267/Sq Ft
Est. Value
About This Home
This home is located at 26386 W Runion Ln, Buckeye, AZ 85396 and is currently estimated at $524,309, approximately $267 per square foot. 26386 W Runion Ln is a home located in Maricopa County with nearby schools including Festival Foothills Elementary School and Wickenburg High School.
Ownership History
Date
Name
Owned For
Owner Type
Purchase Details
Closed on
Jan 20, 2022
Sold by
Brown James P and Brown Shirleen F
Bought by
Niklasch Kevin and Miller-Niklasch Denise
Current Estimated Value
Home Financials for this Owner
Home Financials are based on the most recent Mortgage that was taken out on this home.
Original Mortgage
$270,000
Outstanding Balance
$249,195
Interest Rate
3.22%
Mortgage Type
New Conventional
Estimated Equity
$275,114
Purchase Details
Closed on
Apr 17, 2008
Sold by
Sweet Lawrence D and Sweet Marcia E
Bought by
Brown James P and Brown Shirleen F
Home Financials for this Owner
Home Financials are based on the most recent Mortgage that was taken out on this home.
Original Mortgage
$196,000
Interest Rate
6.42%
Mortgage Type
New Conventional
Purchase Details
Closed on
Nov 16, 2006
Sold by
Pulte Home Corp
Bought by
Sweet Lawrence D and Sweet Marcia E
Home Financials for this Owner
Home Financials are based on the most recent Mortgage that was taken out on this home.
Original Mortgage
$70,400
Interest Rate
6.28%
Mortgage Type
Stand Alone Second
Create a Home Valuation Report for This Property
The Home Valuation Report is an in-depth analysis detailing your home's value as well as a comparison with similar homes in the area
Home Values in the Area
Average Home Value in this Area
Purchase History
| Date | Buyer | Sale Price | Title Company |
|---|---|---|---|
| Niklasch Kevin | $558,000 | Equity Title | |
| Brown James P | $245,000 | Security Title Agency Inc | |
| Sweet Lawrence D | $352,285 | Sun Title Agency Co |
Source: Public Records
Mortgage History
| Date | Status | Borrower | Loan Amount |
|---|---|---|---|
| Open | Niklasch Kevin | $270,000 | |
| Previous Owner | Brown James P | $196,000 | |
| Previous Owner | Sweet Lawrence D | $70,400 |
Source: Public Records
Tax History Compared to Growth
Tax History
| Year | Tax Paid | Tax Assessment Tax Assessment Total Assessment is a certain percentage of the fair market value that is determined by local assessors to be the total taxable value of land and additions on the property. | Land | Improvement |
|---|---|---|---|---|
| 2025 | $4,659 | $39,156 | -- | -- |
| 2024 | $3,723 | $37,292 | -- | -- |
| 2023 | $3,723 | $43,110 | $8,620 | $34,490 |
| 2022 | $3,616 | $34,420 | $6,880 | $27,540 |
| 2021 | $3,636 | $33,400 | $6,680 | $26,720 |
| 2020 | $3,482 | $30,680 | $6,130 | $24,550 |
| 2019 | $3,737 | $30,460 | $6,090 | $24,370 |
| 2018 | $3,723 | $32,320 | $6,460 | $25,860 |
| 2017 | $3,686 | $29,450 | $5,890 | $23,560 |
| 2016 | $2,644 | $29,150 | $5,830 | $23,320 |
| 2015 | $3,423 | $27,460 | $5,490 | $21,970 |
Source: Public Records
Map
Nearby Homes
- 20558 N 263rd Dr
- 26474 W Runion Dr
- 26458 W Yukon Dr
- 26297 W Burnett Rd
- 20250 N 262nd Dr
- 20359 N 262nd Dr
- 20736 N 263rd Dr
- 20595 N 262nd Dr
- 20338 N 262nd Ave
- 26189 W Runion Dr
- 20356 N 261st Dr
- 20669 N 266th Ave
- 26140 W Runion Dr
- 26150 W Burnett Rd
- 20518 N 261st Ave
- 26704 W Tonopah Dr
- 20512 N 260th Ln
- 26078 W Potter Dr
- 26058 W Yukon Dr
- 26234 W Behrend Dr
- 26376 W Runion Ln
- 26400 W Runion Ln
- 26362 W Runion Ln
- 20408 N 263rd Dr
- 20308 N 263rd Dr
- 26422 W Runion Ln
- 26399 W Runion Ln
- 26352 W Runion Ln
- 26417 W Runion Ln
- 20490 N 263rd Dr
- 20388 N 263rd Dr
- 26359 W Runion Ln
- 20510 N 263rd Dr
- 26438 W Runion Ln
- 20368 N 263rd Dr
- 26349 W Runion Ln
- 26378 W Tonopah Dr
- 26433 W Runion Ln
- 20530 N 263rd Dr
- 20467 N 263rd Dr