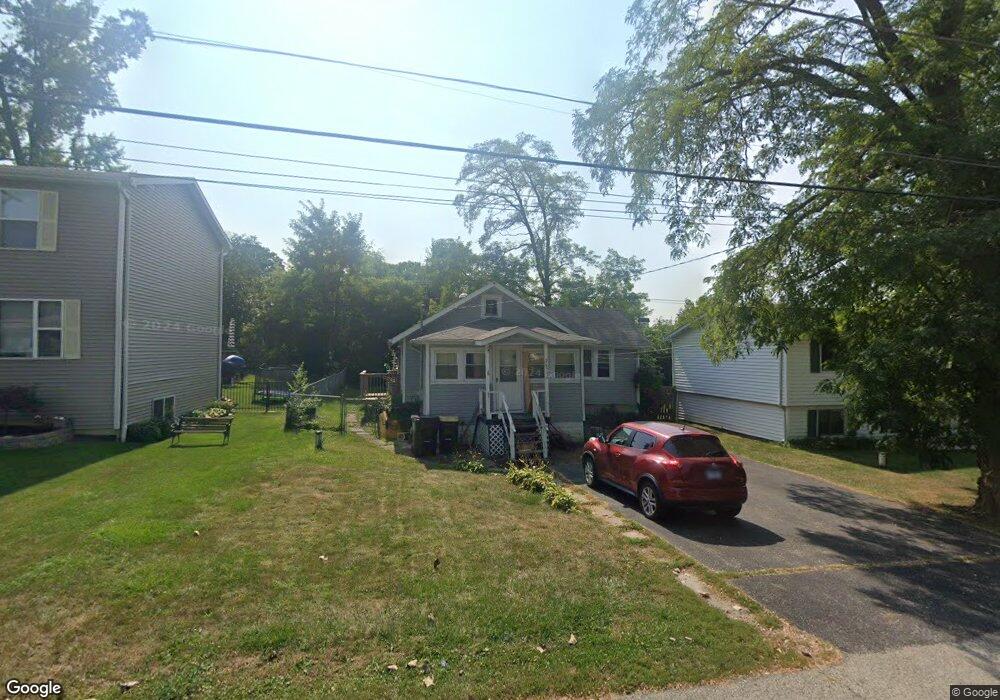
26389 W Blackhawk Ave Ingleside, IL 60041
Estimated Value: $161,528 - $220,000
--
Bed
1
Bath
830
Sq Ft
$227/Sq Ft
Est. Value
About This Home
This home is located at 26389 W Blackhawk Ave, Ingleside, IL 60041 and is currently estimated at $188,632, approximately $227 per square foot. 26389 W Blackhawk Ave is a home located in Lake County with nearby schools including Gavin Central Elementary School, Gavin South Middle School, and Grant Community High School.
Ownership History
Date
Name
Owned For
Owner Type
Purchase Details
Closed on
Jun 15, 2023
Sold by
Nokes Tim
Bought by
Makorewicz Pan
Current Estimated Value
Purchase Details
Closed on
Oct 12, 2018
Sold by
Bayview Loan Servicing Llc
Bought by
Nokes Tim and Makarewicz Don
Purchase Details
Closed on
Nov 25, 2008
Sold by
Olsen Geraldine M
Bought by
The Geraldine M Olsen Living Trust
Purchase Details
Closed on
Jul 14, 1995
Sold by
Layton Durwood L and Layton Christine K
Bought by
Olsen Geraldine M
Home Financials for this Owner
Home Financials are based on the most recent Mortgage that was taken out on this home.
Original Mortgage
$76,074
Interest Rate
7.56%
Mortgage Type
FHA
Purchase Details
Closed on
May 8, 1995
Sold by
Layton Gary J
Bought by
Layton Durwood L and Layton Christine K
Create a Home Valuation Report for This Property
The Home Valuation Report is an in-depth analysis detailing your home's value as well as a comparison with similar homes in the area
Home Values in the Area
Average Home Value in this Area
Purchase History
| Date | Buyer | Sale Price | Title Company |
|---|---|---|---|
| Makorewicz Pan | -- | None Listed On Document | |
| Nokes Tim | $46,000 | None Available | |
| The Geraldine M Olsen Living Trust | -- | None Available | |
| Olsen Geraldine M | $76,500 | Attorneys Natl Title Network | |
| Layton Durwood L | -- | -- |
Source: Public Records
Mortgage History
| Date | Status | Borrower | Loan Amount |
|---|---|---|---|
| Previous Owner | Olsen Geraldine M | $76,074 |
Source: Public Records
Tax History Compared to Growth
Tax History
| Year | Tax Paid | Tax Assessment Tax Assessment Total Assessment is a certain percentage of the fair market value that is determined by local assessors to be the total taxable value of land and additions on the property. | Land | Improvement |
|---|---|---|---|---|
| 2024 | $3,447 | $47,145 | $4,966 | $42,179 |
| 2023 | $3,082 | $44,413 | $4,678 | $39,735 |
| 2022 | $3,082 | $38,809 | $2,833 | $35,976 |
| 2021 | $2,990 | $36,581 | $2,670 | $33,911 |
| 2020 | $2,797 | $32,776 | $2,632 | $30,144 |
| 2019 | $2,709 | $31,431 | $2,524 | $28,907 |
| 2018 | $1,320 | $15,214 | $3,167 | $12,047 |
| 2017 | $1,304 | $14,062 | $2,927 | $11,135 |
| 2016 | $2 | $12,861 | $2,677 | $10,184 |
| 2015 | $3 | $12,002 | $2,498 | $9,504 |
| 2014 | $12 | $11,021 | $3,419 | $7,602 |
| 2012 | $1,061 | $11,973 | $3,832 | $8,141 |
Source: Public Records
Map
Nearby Homes
- 35663 N Helendale Rd
- 35105 N Ingleside Dr
- 605 Rollins Rd
- 26177 W Lakeview Ave
- 35729 N Watson Ave
- 35107 N Rosewood Ave
- 35694 N Laurel Ave
- 35720 N Laurel Ave
- 35835 N Benjamin Ave
- 35025 N Ingleside Dr
- 26276 W Larkin Ln
- 314 Mastodon Dr
- 35063 N Emerald Shores Ct
- 35080 N Ellen Dr
- 26297 W Larkin Ln
- 69 Washington St
- 34966 N Forest Ave
- 35531 N Sunnyside Ave
- 26931 W Marion Ct
- 35242 N Moody St
- 26377 W Blackhawk Ave
- 26397 W Blackhawk Ave
- 26409 W Blackhawk Ave
- 26373 W Blackhawk Ave
- 26369 W Blackhawk Ave
- 26388 W Blackhawk Ave
- 26376 W Blackhawk Ave
- 26374 W Blackhawk Ave
- 26357 W Blackhawk Ave
- 26370 W Blackhawk Ave
- 26349 W Blackhawk Ave
- 26356 W Blackhawk Ave
- 26345 W Blackhawk Ave
- 26348 W Blackhawk Ave
- 26331 W Blackhawk Ave
- 26334 W Blackhawk Ave
- 26324 W Blackhawk Ave
- 26323 W Blackhawk Ave
- 26320 W Blackhawk Ave
- 26319 W Blackhawk Ave