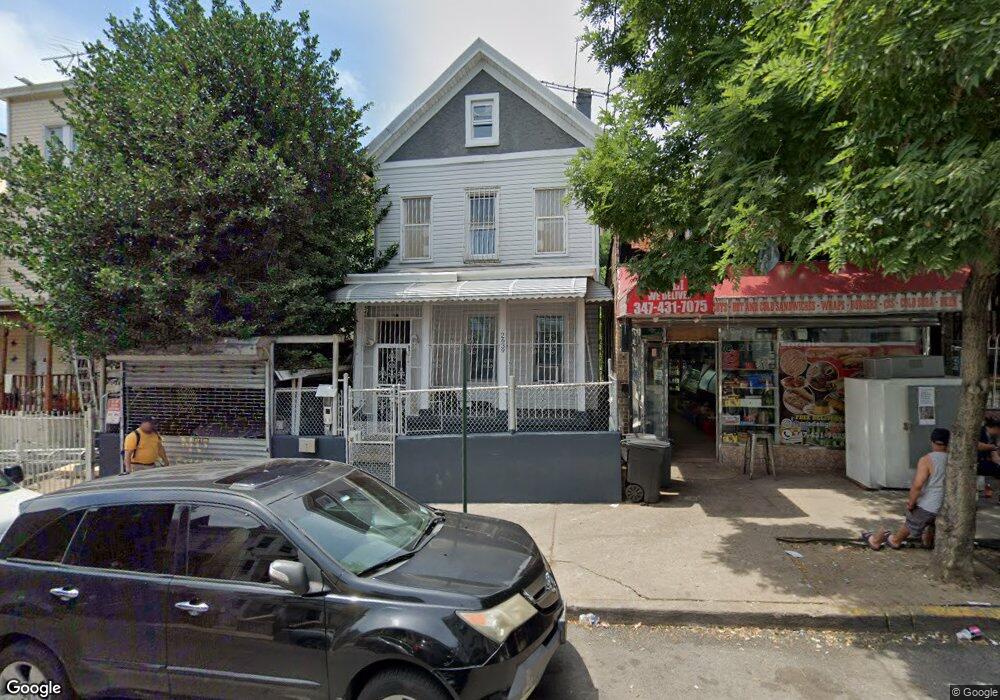
2639 Decatur Ave Unit 3 Bronx, NY 10458
Fordham Manor NeighborhoodEstimated Value: $594,000 - $842,000
2
Beds
2
Baths
900
Sq Ft
$819/Sq Ft
Est. Value
About This Home
This home is located at 2639 Decatur Ave Unit 3, Bronx, NY 10458 and is currently estimated at $737,336, approximately $819 per square foot. 2639 Decatur Ave Unit 3 is a home located in Bronx County with nearby schools including P.S. I.S. 54 and Thomas C Giordano Middleschool 45.
Ownership History
Date
Name
Owned For
Owner Type
Purchase Details
Closed on
Jul 21, 2022
Sold by
2639 Decatur Llc
Bought by
Rodriguez Zumilda Estevez
Current Estimated Value
Home Financials for this Owner
Home Financials are based on the most recent Mortgage that was taken out on this home.
Original Mortgage
$718,741
Outstanding Balance
$687,708
Interest Rate
5.78%
Mortgage Type
Purchase Money Mortgage
Estimated Equity
$49,628
Purchase Details
Closed on
Mar 13, 2020
Sold by
Rosario As Surviving Spouse Isaias
Bought by
2639 Decatur Llc
Home Financials for this Owner
Home Financials are based on the most recent Mortgage that was taken out on this home.
Original Mortgage
$255,000
Interest Rate
3.4%
Mortgage Type
Unknown
Purchase Details
Closed on
Mar 19, 2002
Sold by
Rosario Isaias
Bought by
Rosario Angelica and Rosario Isaias
Create a Home Valuation Report for This Property
The Home Valuation Report is an in-depth analysis detailing your home's value as well as a comparison with similar homes in the area
Home Values in the Area
Average Home Value in this Area
Purchase History
| Date | Buyer | Sale Price | Title Company |
|---|---|---|---|
| Rodriguez Zumilda Estevez | $732,000 | -- | |
| 2639 Decatur Llc | $285,000 | -- | |
| Rosario Angelica | -- | -- |
Source: Public Records
Mortgage History
| Date | Status | Borrower | Loan Amount |
|---|---|---|---|
| Open | Rodriguez Zumilda Estevez | $718,741 | |
| Previous Owner | 2639 Decatur Llc | $255,000 |
Source: Public Records
Tax History Compared to Growth
Tax History
| Year | Tax Paid | Tax Assessment Tax Assessment Total Assessment is a certain percentage of the fair market value that is determined by local assessors to be the total taxable value of land and additions on the property. | Land | Improvement |
|---|---|---|---|---|
| 2025 | $3,973 | $20,098 | $4,463 | $15,635 |
| 2024 | $3,973 | $19,781 | $5,037 | $14,744 |
| 2023 | $3,790 | $18,662 | $4,598 | $14,064 |
| 2022 | $3,547 | $33,300 | $8,220 | $25,080 |
| 2021 | $3,528 | $27,060 | $8,220 | $18,840 |
| 2020 | $3,545 | $27,960 | $8,220 | $19,740 |
| 2019 | $3,155 | $25,140 | $8,220 | $16,920 |
| 2018 | $2,873 | $15,552 | $5,097 | $10,455 |
| 2017 | $2,719 | $14,808 | $5,297 | $9,511 |
| 2016 | $2,483 | $13,971 | $5,580 | $8,391 |
| 2015 | $1,465 | $13,957 | $5,116 | $8,841 |
| 2014 | $1,465 | $13,737 | $6,046 | $7,691 |
Source: Public Records
Map
Nearby Homes
- 2611 Decatur Ave
- 2640 Marion Ave Unit 4E
- 2640 Marion Ave Unit 6H
- 350 E 193rd St
- 2670 Marion Ave
- 2661 Marion Ave Unit 1H
- 2661 Marion Ave Unit 3C
- 2661 Marion Ave Unit 5A
- 2675 Marion Ave
- 2696 Marion Ave
- 2677 Marion Ave
- 2703 Bainbridge Ave
- 2655 Briggs Ave
- 2503 Marion Ave
- 2779 Marion Ave
- 2798 Pond Place
- 398 Oliver Place Unit 6G
- 398 Oliver Place Unit 1A
- 2830 Briggs Ave Unit WIA
- 2830 Briggs Ave Unit 5B
- 2639 Decatur Ave
- 373 E 194th St
- 369 E 194th St
- 365 E 194th St
- 363 E 194th St
- 2641 Decatur Ave
- 361 E 194th St
- 2649 Decatur Ave
- 2636 Decatur Ave
- 2634 Decatur Ave
- 2638-2640 Decatur Ave
- 2632 Decatur Ave
- 2638 Decatur Ave Unit 2640
- 2630 Decatur Ave
- 2613 Decatur Ave
- 2613 Decatur Ave Unit 1
- 2613 Decatur Ave Unit 2
- 368 E 194 St
- 2653 Decatur Ave
- 355 E 194th St