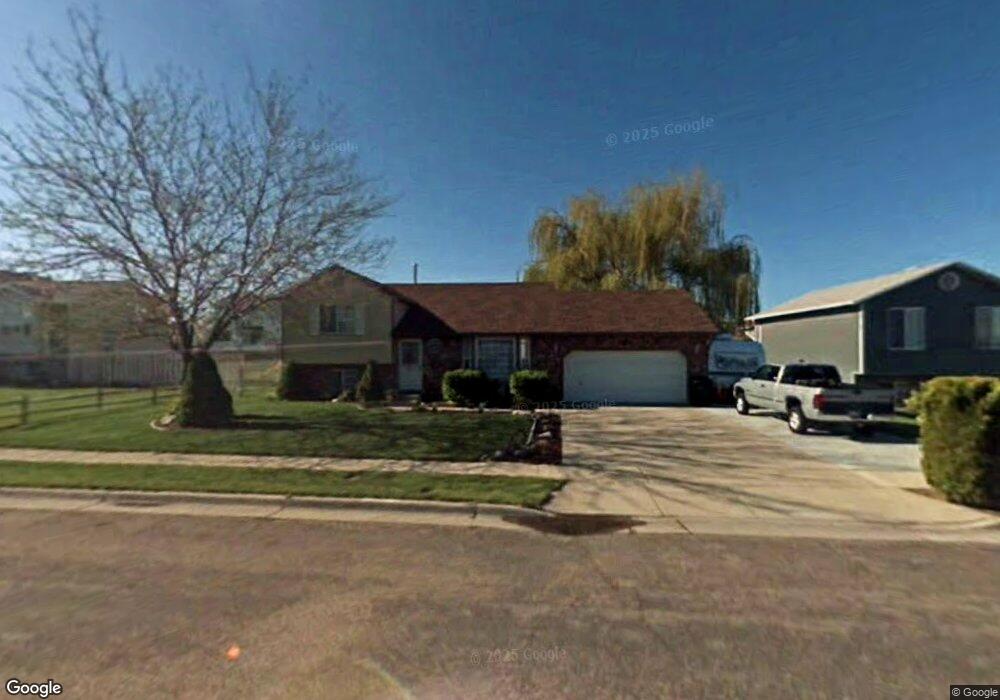
2639 W 1550 N Clearfield, UT 84015
Estimated Value: $424,000 - $473,000
4
Beds
2
Baths
1,758
Sq Ft
$254/Sq Ft
Est. Value
About This Home
This home is located at 2639 W 1550 N, Clearfield, UT 84015 and is currently estimated at $446,026, approximately $253 per square foot. 2639 W 1550 N is a home located in Davis County with nearby schools including West Clinton Elementary School, West Point Junior High School, and Syracuse High School.
Ownership History
Date
Name
Owned For
Owner Type
Purchase Details
Closed on
Nov 3, 2022
Sold by
Cannon Kade H and Cannon Elizabeth E
Bought by
Nelson Anthony and Nelson Malissa
Current Estimated Value
Home Financials for this Owner
Home Financials are based on the most recent Mortgage that was taken out on this home.
Original Mortgage
$412,392
Outstanding Balance
$398,575
Interest Rate
6.7%
Mortgage Type
FHA
Estimated Equity
$47,451
Purchase Details
Closed on
Jun 23, 2014
Sold by
Moore Kevin D and Moore Sharon M
Bought by
Cannon Kade H and Cannon Elizabeth E
Home Financials for this Owner
Home Financials are based on the most recent Mortgage that was taken out on this home.
Original Mortgage
$152,625
Interest Rate
4.12%
Mortgage Type
FHA
Create a Home Valuation Report for This Property
The Home Valuation Report is an in-depth analysis detailing your home's value as well as a comparison with similar homes in the area
Home Values in the Area
Average Home Value in this Area
Purchase History
| Date | Buyer | Sale Price | Title Company |
|---|---|---|---|
| Nelson Anthony | -- | Metro National Title | |
| Cannon Kade H | -- | Big Sky Title |
Source: Public Records
Mortgage History
| Date | Status | Borrower | Loan Amount |
|---|---|---|---|
| Open | Nelson Anthony | $412,392 | |
| Previous Owner | Cannon Kade H | $152,625 |
Source: Public Records
Tax History Compared to Growth
Tax History
| Year | Tax Paid | Tax Assessment Tax Assessment Total Assessment is a certain percentage of the fair market value that is determined by local assessors to be the total taxable value of land and additions on the property. | Land | Improvement |
|---|---|---|---|---|
| 2025 | $2,408 | $231,550 | $85,155 | $146,395 |
| 2024 | $2,322 | $224,400 | $94,124 | $130,276 |
| 2023 | $2,114 | $378,000 | $106,177 | $271,823 |
| 2022 | $2,090 | $206,801 | $66,072 | $140,729 |
| 2021 | $1,915 | $281,000 | $80,820 | $200,180 |
| 2020 | $1,666 | $242,000 | $67,689 | $174,311 |
| 2019 | $1,628 | $231,000 | $80,934 | $150,066 |
| 2018 | $1,506 | $210,000 | $68,602 | $141,398 |
| 2016 | $1,406 | $101,201 | $26,505 | $74,696 |
| 2015 | $1,299 | $88,936 | $26,505 | $62,431 |
| 2014 | $1,272 | $88,414 | $26,505 | $61,909 |
| 2013 | -- | $80,683 | $24,320 | $56,363 |
Source: Public Records
Map
Nearby Homes
- 2647 W 1445 N
- 1648 N 2615 W
- 1509 N 2475 W
- 1449 N 2475 W
- 1458 N 2400 W
- 1251 N 2525 W
- 2921 W 1300 N
- 2959 W 1300 N
- 2371 W 1300 N
- 3941 W 1800 N
- 1172 N 3000 W
- 2259 W 1800 N
- 1694 N 2225 W
- 3168 W 1300 N
- 2148 W 1570 N
- 2816 W 960 N
- 2617 N 2080 W Unit 176
- 1502 N 2090 W
- 878 N 2600 W
- Harvard Plan at Summerfield - Enclave