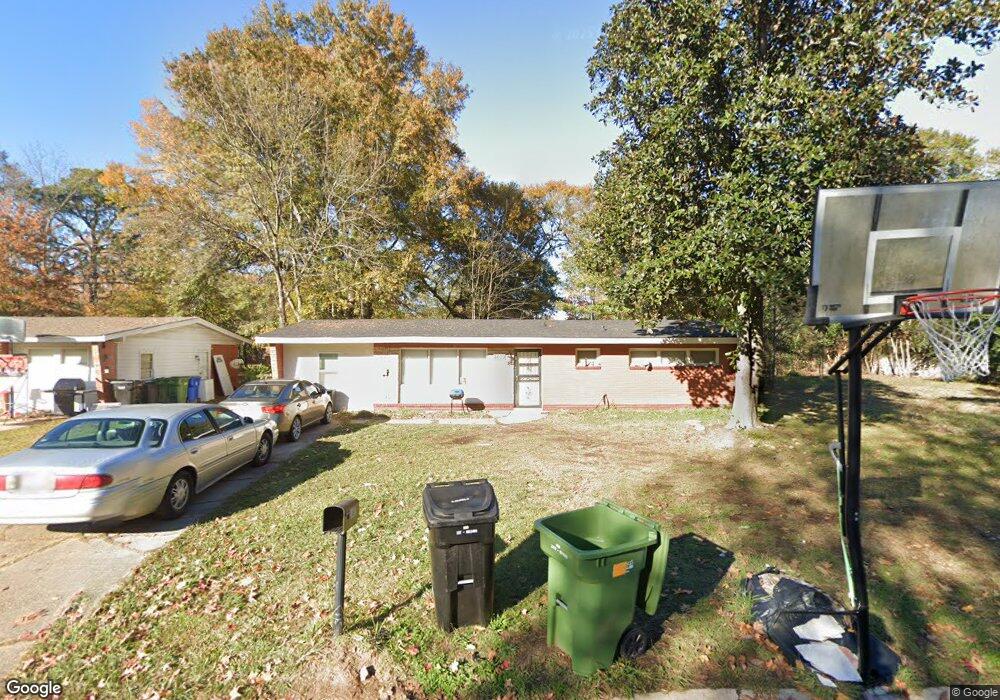
2639 Wise St Columbus, GA 31903
South Columbus NeighborhoodEstimated Value: $77,000 - $100,000
3
Beds
2
Baths
1,092
Sq Ft
$77/Sq Ft
Est. Value
About This Home
This home is located at 2639 Wise St, Columbus, GA 31903 and is currently estimated at $84,578, approximately $77 per square foot. 2639 Wise St is a home located in Muscogee County with nearby schools including Key Elementary School, Eddy Middle School, and Spencer High School.
Ownership History
Date
Name
Owned For
Owner Type
Purchase Details
Closed on
Feb 19, 2020
Sold by
Riversouth Properties Llc
Bought by
Wwm Properties Ventures Llc
Current Estimated Value
Purchase Details
Closed on
Jan 10, 2020
Sold by
Boyer Ronald Scott
Bought by
Riversouth Properties Llc
Purchase Details
Closed on
Jan 15, 2016
Sold by
Cuzcano Rafael
Bought by
Lane Ronald Scott
Home Financials for this Owner
Home Financials are based on the most recent Mortgage that was taken out on this home.
Original Mortgage
$18,140
Interest Rate
3.99%
Purchase Details
Closed on
Jan 28, 2015
Sold by
Riversouth Properties Llc
Bought by
Cuzcano Rafael and Cuzcano Melissa
Purchase Details
Closed on
Oct 23, 2014
Sold by
Ramos Soto Jose
Bought by
Riversouth Properties Llc
Purchase Details
Closed on
Oct 9, 2014
Sold by
Rodriguez Carmen R
Bought by
Ramos Soto Jose
Create a Home Valuation Report for This Property
The Home Valuation Report is an in-depth analysis detailing your home's value as well as a comparison with similar homes in the area
Home Values in the Area
Average Home Value in this Area
Purchase History
| Date | Buyer | Sale Price | Title Company |
|---|---|---|---|
| Wwm Properties Ventures Llc | $24,600 | -- | |
| Riversouth Properties Llc | $14,500 | -- | |
| Lane Ronald Scott | $43,000 | -- | |
| Cuzcano Rafael | $17,500 | -- | |
| Riversouth Properties Llc | $11,000 | -- | |
| Ramos Soto Jose | -- | -- |
Source: Public Records
Mortgage History
| Date | Status | Borrower | Loan Amount |
|---|---|---|---|
| Previous Owner | Lane Ronald Scott | $18,140 |
Source: Public Records
Tax History
| Year | Tax Paid | Tax Assessment Tax Assessment Total Assessment is a certain percentage of the fair market value that is determined by local assessors to be the total taxable value of land and additions on the property. | Land | Improvement |
|---|---|---|---|---|
| 2025 | $799 | $20,400 | $4,212 | $16,188 |
| 2024 | $980 | $38,336 | $4,212 | $34,124 |
| 2023 | $622 | $22,452 | $4,212 | $18,240 |
| 2022 | $645 | $15,788 | $4,212 | $11,576 |
| 2021 | $402 | $9,840 | $2,120 | $7,720 |
| 2020 | $156 | $19,268 | $4,212 | $15,056 |
| 2019 | $158 | $19,268 | $4,212 | $15,056 |
| 2018 | $158 | $19,268 | $4,212 | $15,056 |
| 2017 | $471 | $17,200 | $3,760 | $13,440 |
| 2016 | $287 | $6,960 | $3,600 | $3,360 |
| 2015 | $182 | $4,400 | $3,600 | $800 |
| 2014 | $303 | $18,336 | $3,600 | $14,736 |
| 2013 | -- | $18,336 | $3,600 | $14,736 |
Source: Public Records
Map
Nearby Homes
- 2720 Wise St
- 2720 Broadmoor Dr
- 2608 Walker St
- 2611 Rice St
- 2450 Cornell Ave
- 2309 Ginny Ave
- 2846 Walker St
- 2550 Cornell Ave
- 2425 Howe Ave
- 2940 Walker St
- 2940 Blan St
- 3044 Wise St
- 3063 Meade St
- 3048 Knox St
- 3015 Hendrix St
- 3018 Plantation Rd
- 2404 Bruce Ave
- 2333 Bruce Ave
- 2102 Somerset Ave
- 2343 Manning Ave
Your Personal Tour Guide
Ask me questions while you tour the home.