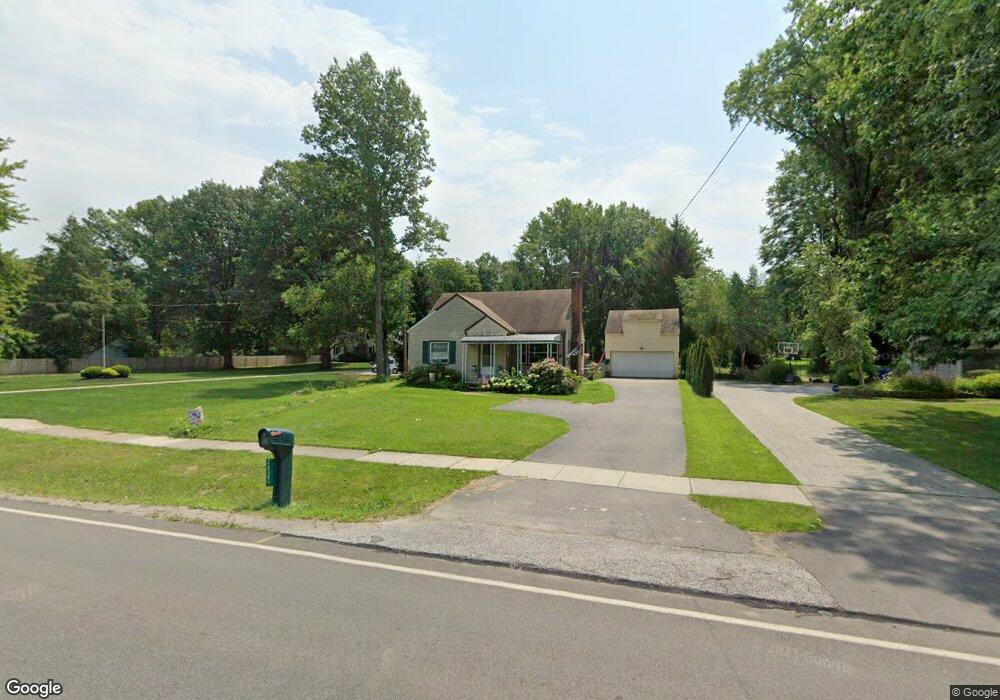
26393 Cook Rd Olmsted Falls, OH 44138
Estimated Value: $236,000 - $302,000
4
Beds
1
Bath
1,626
Sq Ft
$166/Sq Ft
Est. Value
About This Home
This home is located at 26393 Cook Rd, Olmsted Falls, OH 44138 and is currently estimated at $269,833, approximately $165 per square foot. 26393 Cook Rd is a home located in Cuyahoga County with nearby schools including Falls-Lenox Primary Elementary School, Olmsted Falls Intermediate Building, and Olmsted Falls Middle School.
Ownership History
Date
Name
Owned For
Owner Type
Purchase Details
Closed on
Aug 18, 1995
Sold by
Kolodey William F
Bought by
Difranco Fred C and Difranco Laverne A
Current Estimated Value
Home Financials for this Owner
Home Financials are based on the most recent Mortgage that was taken out on this home.
Original Mortgage
$90,000
Interest Rate
7.64%
Mortgage Type
New Conventional
Purchase Details
Closed on
Mar 26, 1991
Sold by
Kolodey William F
Bought by
Kolodey William F
Purchase Details
Closed on
Nov 23, 1990
Sold by
Kolodey Anna
Bought by
Kolodey William F
Purchase Details
Closed on
Feb 28, 1989
Sold by
Kolodey Anna
Bought by
Kolodey Anna
Purchase Details
Closed on
Jan 1, 1975
Bought by
Kolodey Anna
Create a Home Valuation Report for This Property
The Home Valuation Report is an in-depth analysis detailing your home's value as well as a comparison with similar homes in the area
Home Values in the Area
Average Home Value in this Area
Purchase History
| Date | Buyer | Sale Price | Title Company |
|---|---|---|---|
| Difranco Fred C | $113,000 | -- | |
| Kolodey William F | -- | -- | |
| Kolodey William F | -- | -- | |
| Kolodey Anna | -- | -- | |
| Kolodey Anna | -- | -- |
Source: Public Records
Mortgage History
| Date | Status | Borrower | Loan Amount |
|---|---|---|---|
| Closed | Difranco Fred C | $90,000 |
Source: Public Records
Tax History Compared to Growth
Tax History
| Year | Tax Paid | Tax Assessment Tax Assessment Total Assessment is a certain percentage of the fair market value that is determined by local assessors to be the total taxable value of land and additions on the property. | Land | Improvement |
|---|---|---|---|---|
| 2024 | $4,460 | $78,400 | $25,795 | $52,605 |
| 2023 | $3,700 | $56,530 | $14,910 | $41,620 |
| 2022 | $3,732 | $56,530 | $14,910 | $41,620 |
| 2021 | $3,135 | $56,530 | $14,910 | $41,620 |
| 2020 | $2,915 | $49,600 | $13,090 | $36,510 |
| 2019 | $2,588 | $141,700 | $37,400 | $104,300 |
| 2018 | $2,582 | $49,600 | $13,090 | $36,510 |
| 2017 | $2,337 | $44,110 | $11,310 | $32,800 |
| 2016 | $2,324 | $44,110 | $11,310 | $32,800 |
| 2015 | $2,970 | $44,110 | $11,310 | $32,800 |
| 2014 | $2,970 | $40,850 | $10,470 | $30,380 |
Source: Public Records
Map
Nearby Homes
- 11 Concert Ct
- 3 Concert Ln
- 42 Periwinkle Dr
- 52 Periwinkle Dr
- 3 Fiddle Sticks
- 16 Van Ess Dr
- 20 Van Ess Dr
- 25725 Cook Rd
- 5 Hawthorn Dr
- 11 Brookins Dr
- 55 Patio Ln
- 3 Dogwood Ln
- 7593 Columbia Rd
- V/L Columbia Rd
- 7030 Columbia Rd
- 25950 Bagley Rd
- 281-12-024 River Rd
- 281-12-007 River Rd
- 7224 Pine Woods Way
- VANDERBURGH Plan at Olmsted - Sanctuary of