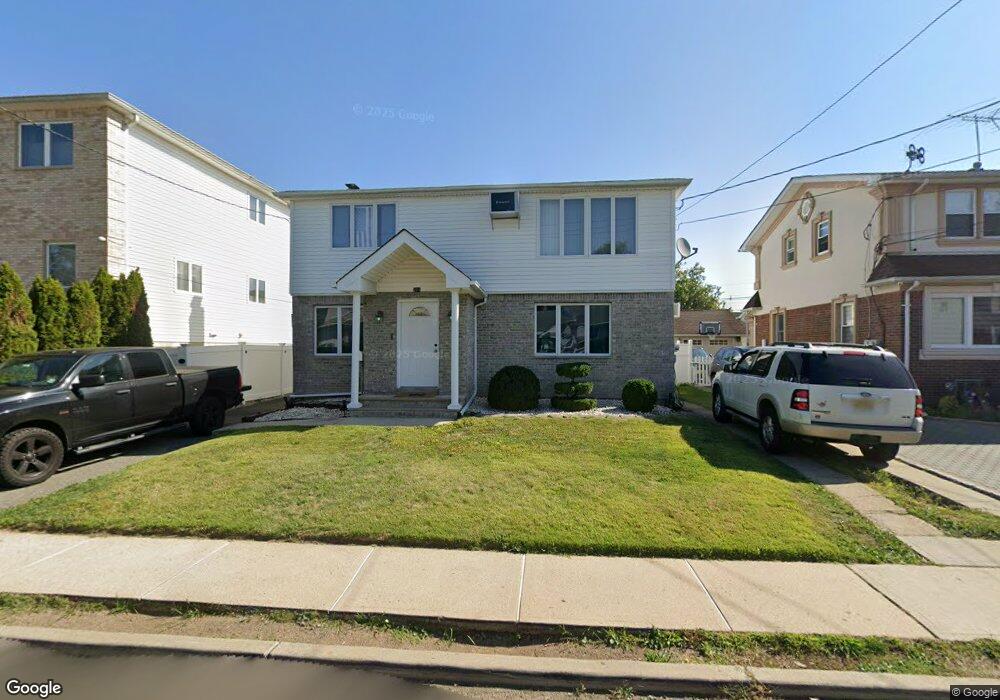
264 3rd St Saddle Brook, NJ 07663
Estimated Value: $729,987 - $900,000
Studio
--
Bath
2,257
Sq Ft
$349/Sq Ft
Est. Value
About This Home
This home is located at 264 3rd St, Saddle Brook, NJ 07663 and is currently estimated at $786,997, approximately $348 per square foot. 264 3rd St is a home located in Bergen County with nearby schools including Saddle Brook Mid High School and Bergen Arts and Sciences Charter School.
Ownership History
Date
Name
Owned For
Owner Type
Purchase Details
Closed on
Feb 11, 2020
Sold by
Lim Aehee and Lim Jung Hyun
Bought by
Lim Jaison J
Current Estimated Value
Purchase Details
Closed on
Oct 27, 2006
Sold by
Galbo Charles J
Bought by
Doherty Christopher J
Home Financials for this Owner
Home Financials are based on the most recent Mortgage that was taken out on this home.
Original Mortgage
$392,000
Interest Rate
6.48%
Purchase Details
Closed on
May 17, 2006
Sold by
Vanauken Eric Van
Bought by
Park Hyon Ju
Purchase Details
Closed on
Jun 20, 2003
Sold by
Carnovale Vincent
Bought by
Sun Jeong
Home Financials for this Owner
Home Financials are based on the most recent Mortgage that was taken out on this home.
Original Mortgage
$264,000
Interest Rate
5.53%
Purchase Details
Closed on
Mar 5, 1999
Sold by
Galbo Charles J and Estate Of Anna Galbo
Bought by
Galbo Charles J and Galbo Nina E
Create a Home Valuation Report for This Property
The Home Valuation Report is an in-depth analysis detailing your home's value as well as a comparison with similar homes in the area
Home Values in the Area
Average Home Value in this Area
Purchase History
| Date | Buyer | Sale Price | Title Company |
|---|---|---|---|
| Lim Jaison J | $600,000 | None Available | |
| Doherty Christopher J | $580,000 | -- | |
| Park Hyon Ju | $585,000 | -- | |
| Sun Jeong | $440,000 | -- | |
| Galbo Charles J | -- | -- |
Source: Public Records
Mortgage History
| Date | Status | Borrower | Loan Amount |
|---|---|---|---|
| Previous Owner | Doherty Christopher J | $392,000 | |
| Previous Owner | Sun Jeong | $264,000 |
Source: Public Records
Tax History
| Year | Tax Paid | Tax Assessment Tax Assessment Total Assessment is a certain percentage of the fair market value that is determined by local assessors to be the total taxable value of land and additions on the property. | Land | Improvement |
|---|---|---|---|---|
| 2025 | $12,671 | $565,000 | $227,500 | $337,500 |
| 2024 | $11,435 | $549,500 | $222,500 | $327,000 |
| 2023 | $10,835 | $489,500 | $203,000 | $286,500 |
| 2022 | $10,835 | $451,100 | $177,500 | $273,600 |
| 2021 | $10,588 | $406,600 | $152,500 | $254,100 |
| 2020 | $10,171 | $395,000 | $149,000 | $246,000 |
| 2019 | $10,053 | $387,700 | $146,500 | $241,200 |
| 2018 | $9,821 | $387,100 | $147,500 | $239,600 |
| 2017 | $10,147 | $393,600 | $145,000 | $248,600 |
| 2016 | $10,612 | $370,400 | $135,000 | $235,400 |
| 2015 | $10,056 | $370,400 | $135,000 | $235,400 |
| 2014 | $9,704 | $370,400 | $135,000 | $235,400 |
Source: Public Records
Map
Nearby Homes
- 345 2nd St
- 337 1st St
- 54 Bergen St
- 319 Outwater Ln
- 512 van Bussum Ave
- 89 Plauderville Ave Unit 10
- 83 Plauderville Ave
- 274 Gaston Ave
- 413 Lanza Ave
- 2 Meyer St
- 520 Victor St Unit 42
- 520 Victor St Unit 8
- 283 Malcolm Ave
- 283 Malcolm Ave Unit 2
- 384 Madeline Ave
- 389 Madeline Ave
- 492 Westminster Place
- 280 Malcolm Ave
- 167 Shaw St
- 19 Plauderville Ave Unit 110
Your Personal Tour Guide
Ask me questions while you tour the home.