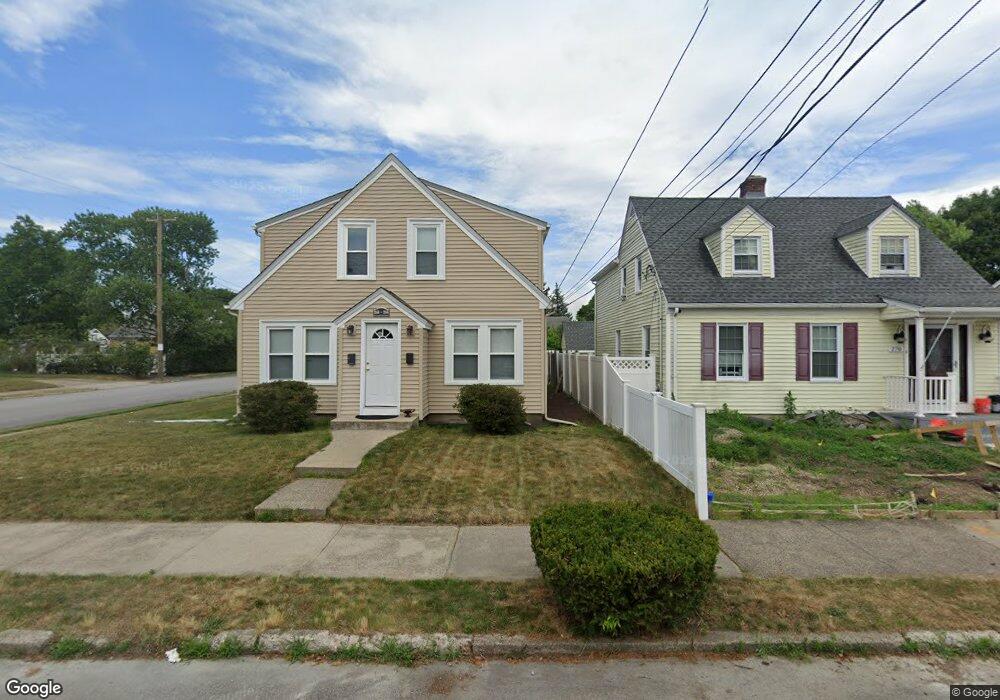
264 Bloomfield St Pawtucket, RI 02861
Darlington NeighborhoodEstimated Value: $450,489 - $581,000
4
Beds
2
Baths
2,400
Sq Ft
$220/Sq Ft
Est. Value
About This Home
This home is located at 264 Bloomfield St, Pawtucket, RI 02861 and is currently estimated at $528,872, approximately $220 per square foot. 264 Bloomfield St is a home located in Providence County with nearby schools including Saint Teresa Catholic Elementary School and St Cecilia School.
Ownership History
Date
Name
Owned For
Owner Type
Purchase Details
Closed on
Feb 8, 2010
Sold by
Tellini Robert A and Tellini John R
Bought by
Tellini John R and Tellini Robert A
Current Estimated Value
Home Financials for this Owner
Home Financials are based on the most recent Mortgage that was taken out on this home.
Original Mortgage
$130,000
Interest Rate
5%
Mortgage Type
Purchase Money Mortgage
Purchase Details
Closed on
Dec 21, 2009
Sold by
Medina Carlos and Arango Omaira
Bought by
Tellini Robert A and Tellini John R
Home Financials for this Owner
Home Financials are based on the most recent Mortgage that was taken out on this home.
Original Mortgage
$130,000
Interest Rate
5%
Mortgage Type
Purchase Money Mortgage
Purchase Details
Closed on
Jun 2, 2006
Sold by
Eaton Lawrence A and Eaton Nancy L
Bought by
Medina Carlos and Arango Omaira
Create a Home Valuation Report for This Property
The Home Valuation Report is an in-depth analysis detailing your home's value as well as a comparison with similar homes in the area
Home Values in the Area
Average Home Value in this Area
Purchase History
| Date | Buyer | Sale Price | Title Company |
|---|---|---|---|
| Tellini John R | -- | -- | |
| Tellini Robert A | $175,000 | -- | |
| Medina Carlos | $300,000 | -- |
Source: Public Records
Mortgage History
| Date | Status | Borrower | Loan Amount |
|---|---|---|---|
| Open | Medina Carlos | $112,000 | |
| Previous Owner | Medina Carlos | $130,000 | |
| Previous Owner | Medina Carlos | $315,056 |
Source: Public Records
Tax History
| Year | Tax Paid | Tax Assessment Tax Assessment Total Assessment is a certain percentage of the fair market value that is determined by local assessors to be the total taxable value of land and additions on the property. | Land | Improvement |
|---|---|---|---|---|
| 2025 | $5,578 | $424,200 | $127,400 | $296,800 |
| 2024 | $5,235 | $424,200 | $127,400 | $296,800 |
| 2023 | $4,918 | $290,300 | $85,600 | $204,700 |
| 2022 | $4,813 | $290,300 | $85,600 | $204,700 |
| 2021 | $4,813 | $290,300 | $85,600 | $204,700 |
| 2020 | $4,404 | $210,800 | $70,800 | $140,000 |
| 2019 | $4,404 | $210,800 | $70,800 | $140,000 |
| 2018 | $4,243 | $210,800 | $70,800 | $140,000 |
| 2017 | $4,044 | $178,000 | $64,400 | $113,600 |
| 2016 | $3,896 | $178,000 | $64,400 | $113,600 |
| 2015 | $3,896 | $178,000 | $64,400 | $113,600 |
| 2014 | $3,830 | $166,100 | $61,400 | $104,700 |
Source: Public Records
Map
Nearby Homes
Your Personal Tour Guide
Ask me questions while you tour the home.