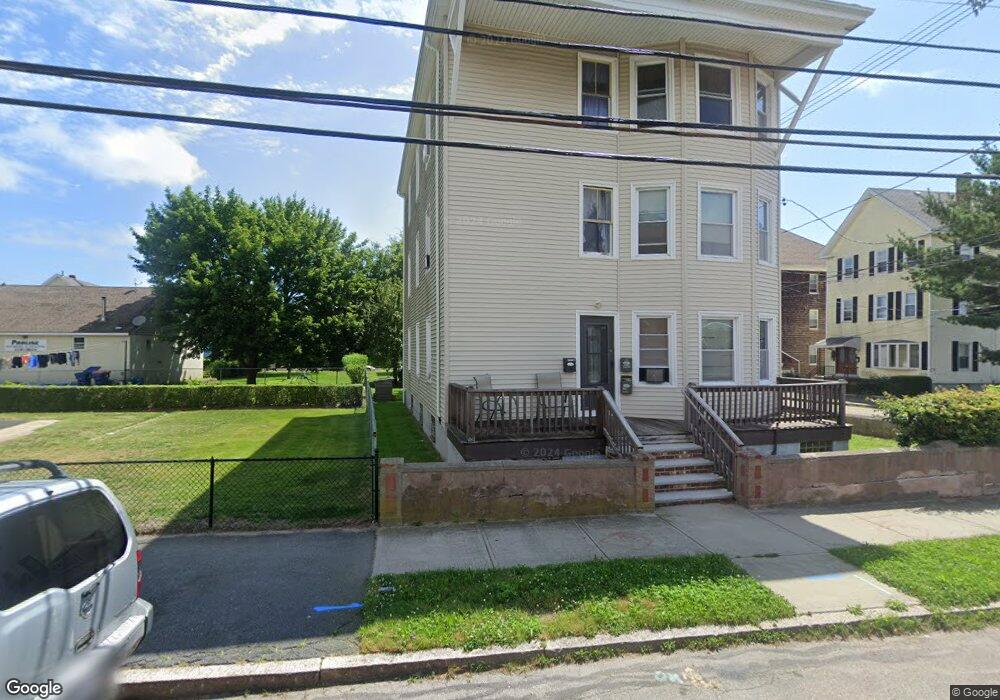
264 Bonney St Unit 3 New Bedford, MA 02744
The South End NeighborhoodEstimated Value: $629,000 - $643,000
3
Beds
1
Bath
1,100
Sq Ft
$576/Sq Ft
Est. Value
About This Home
This home is located at 264 Bonney St Unit 3, New Bedford, MA 02744 and is currently estimated at $634,000, approximately $576 per square foot. 264 Bonney St Unit 3 is a home located in Bristol County with nearby schools including John B. DeValles Elementary School, Roosevelt Middle School, and New Bedford High School.
Ownership History
Date
Name
Owned For
Owner Type
Purchase Details
Closed on
Jul 5, 2018
Sold by
Fish Mary C
Bought by
Fish Mary C
Current Estimated Value
Create a Home Valuation Report for This Property
The Home Valuation Report is an in-depth analysis detailing your home's value as well as a comparison with similar homes in the area
Home Values in the Area
Average Home Value in this Area
Purchase History
| Date | Buyer | Sale Price | Title Company |
|---|---|---|---|
| Fish Mary C | -- | -- | |
| Fish Mary C | -- | -- |
Source: Public Records
Tax History Compared to Growth
Tax History
| Year | Tax Paid | Tax Assessment Tax Assessment Total Assessment is a certain percentage of the fair market value that is determined by local assessors to be the total taxable value of land and additions on the property. | Land | Improvement |
|---|---|---|---|---|
| 2025 | $5,594 | $494,600 | $81,000 | $413,600 |
| 2024 | $5,068 | $422,300 | $75,900 | $346,400 |
| 2023 | $4,514 | $315,900 | $64,800 | $251,100 |
| 2022 | $3,991 | $263,200 | $59,000 | $204,200 |
| 2021 | $3,991 | $256,000 | $59,000 | $197,000 |
| 2020 | $4,454 | $242,100 | $55,700 | $186,400 |
| 2019 | $4,239 | $203,300 | $55,700 | $147,600 |
| 2018 | $3,176 | $191,000 | $55,700 | $135,300 |
| 2017 | $2,929 | $175,500 | $55,700 | $119,800 |
| 2016 | $2,831 | $171,700 | $57,400 | $114,300 |
| 2015 | $2,665 | $169,400 | $59,000 | $110,400 |
| 2014 | $2,568 | $169,400 | $59,000 | $110,400 |
Source: Public Records
Map
Nearby Homes
- 264 Bonney St
- 252 Bonney St
- 131 Crapo St Unit 133
- 110 Winsor St
- 143 Crapo St
- 123 Crapo St
- 286 Bonney St
- 145 Crapo St Unit 147
- 288 Bonney St
- 149 Crapo St
- 136 Crapo St Unit 138
- 89 Winsor St
- 130 Crapo St
- 142 Crapo St
- 124 Crapo St Unit 1
- 124 Crapo St Unit 2N
- 124 Crapo St
- 290 Bonney St
- 153 Crapo St
- 103 Mosher St