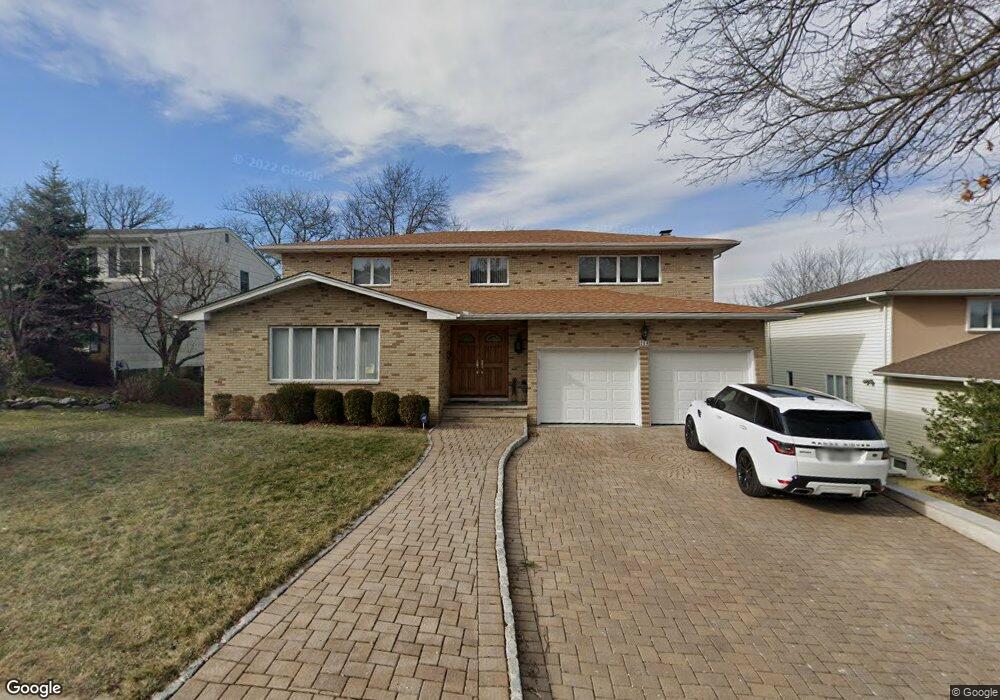
264 Center St Englewood Cliffs, NJ 07632
Estimated Value: $1,495,000 - $1,756,000
--
Bed
--
Bath
3,398
Sq Ft
$479/Sq Ft
Est. Value
About This Home
This home is located at 264 Center St, Englewood Cliffs, NJ 07632 and is currently estimated at $1,627,599, approximately $478 per square foot. 264 Center St is a home located in Bergen County with nearby schools including North Cliff Elementary School, Upper School Elementary School, and Dwight-Englewood School.
Ownership History
Date
Name
Owned For
Owner Type
Purchase Details
Closed on
Aug 1, 2000
Sold by
Kramis Gus and Kramis Bessie
Bought by
Mchale John J and Mchale Margarita
Current Estimated Value
Home Financials for this Owner
Home Financials are based on the most recent Mortgage that was taken out on this home.
Original Mortgage
$562,500
Outstanding Balance
$203,812
Interest Rate
8.21%
Mortgage Type
Stand Alone First
Estimated Equity
$1,423,787
Create a Home Valuation Report for This Property
The Home Valuation Report is an in-depth analysis detailing your home's value as well as a comparison with similar homes in the area
Home Values in the Area
Average Home Value in this Area
Purchase History
| Date | Buyer | Sale Price | Title Company |
|---|---|---|---|
| Mchale John J | $720,000 | Lawyers Title Insurance Corp |
Source: Public Records
Mortgage History
| Date | Status | Borrower | Loan Amount |
|---|---|---|---|
| Open | Mchale John J | $562,500 |
Source: Public Records
Tax History Compared to Growth
Tax History
| Year | Tax Paid | Tax Assessment Tax Assessment Total Assessment is a certain percentage of the fair market value that is determined by local assessors to be the total taxable value of land and additions on the property. | Land | Improvement |
|---|---|---|---|---|
| 2025 | $13,054 | $1,130,200 | $599,100 | $531,100 |
| 2024 | $12,896 | $1,130,200 | $599,100 | $531,100 |
| 2023 | $12,692 | $1,130,200 | $599,100 | $531,100 |
| 2022 | $12,692 | $1,130,200 | $599,100 | $531,100 |
| 2021 | $12,703 | $1,130,200 | $599,100 | $531,100 |
| 2020 | $13,009 | $1,130,200 | $599,100 | $531,100 |
| 2019 | $12,217 | $1,130,200 | $599,100 | $531,100 |
| 2018 | $11,788 | $1,130,200 | $599,100 | $531,100 |
| 2017 | $11,279 | $1,130,200 | $599,100 | $531,100 |
| 2016 | $11,065 | $1,130,200 | $599,100 | $531,100 |
| 2015 | $10,511 | $1,130,200 | $599,100 | $531,100 |
| 2014 | $9,833 | $1,130,200 | $599,100 | $531,100 |
Source: Public Records
Map
Nearby Homes