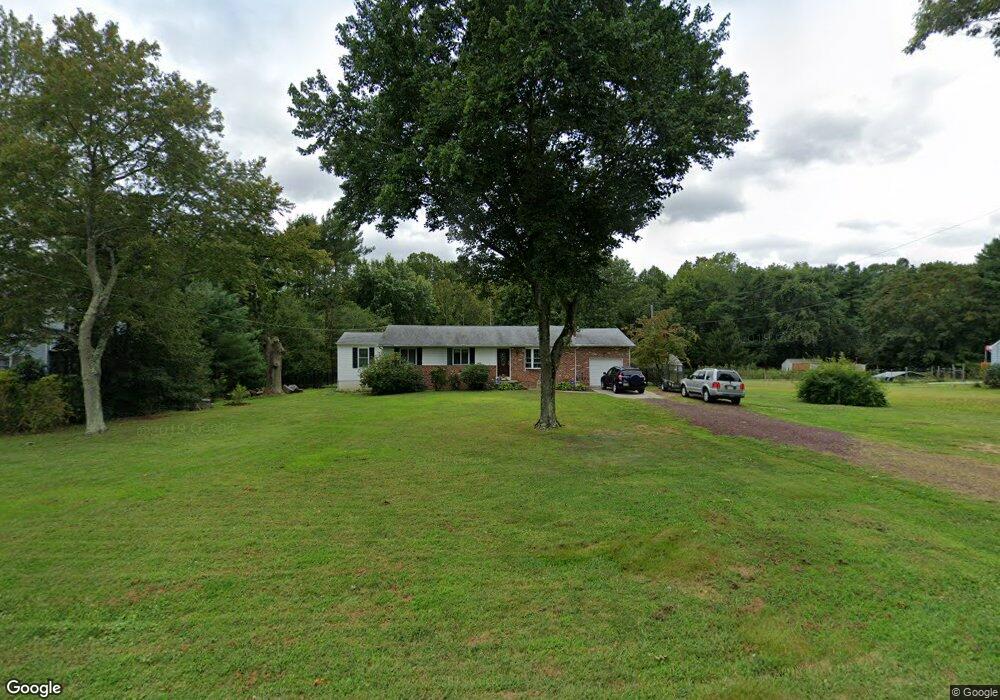
264 Clems Run Mullica Hill, NJ 08062
Estimated Value: $349,865 - $502,000
--
Bed
--
Bath
1,854
Sq Ft
$241/Sq Ft
Est. Value
About This Home
This home is located at 264 Clems Run, Mullica Hill, NJ 08062 and is currently estimated at $445,966, approximately $240 per square foot. 264 Clems Run is a home located in Gloucester County with nearby schools including Harrison Township Elementary School, Pleasant Valley School, and Clearview Regional Middle School.
Ownership History
Date
Name
Owned For
Owner Type
Purchase Details
Closed on
Aug 25, 1998
Sold by
Shaw Fennis S and Palin Kathie M
Bought by
Shaw Fennis S
Current Estimated Value
Home Financials for this Owner
Home Financials are based on the most recent Mortgage that was taken out on this home.
Original Mortgage
$136,486
Outstanding Balance
$29,155
Interest Rate
6.9%
Estimated Equity
$416,811
Purchase Details
Closed on
Jan 29, 1998
Sold by
Shaw Fennis S
Bought by
Shaw Fennis S and Palin Kathie M
Home Financials for this Owner
Home Financials are based on the most recent Mortgage that was taken out on this home.
Original Mortgage
$130,575
Interest Rate
6.9%
Mortgage Type
FHA
Purchase Details
Closed on
Sep 21, 1995
Sold by
Shaw Fennis S
Bought by
Shaw Fennis S
Purchase Details
Closed on
Apr 21, 1995
Sold by
Hyde Jeffrey L and Hyde Etta M
Bought by
Shaw Fennis S
Create a Home Valuation Report for This Property
The Home Valuation Report is an in-depth analysis detailing your home's value as well as a comparison with similar homes in the area
Home Values in the Area
Average Home Value in this Area
Purchase History
| Date | Buyer | Sale Price | Title Company |
|---|---|---|---|
| Shaw Fennis S | -- | -- | |
| Shaw Fennis S | -- | New Jersey Title Insurance C | |
| Shaw Fennis S | -- | Lawrence Abstract Company | |
| Shaw Fennis S | $129,900 | -- |
Source: Public Records
Mortgage History
| Date | Status | Borrower | Loan Amount |
|---|---|---|---|
| Open | Shaw Fennis S | $136,486 | |
| Closed | Shaw Fennis S | $130,575 |
Source: Public Records
Tax History Compared to Growth
Tax History
| Year | Tax Paid | Tax Assessment Tax Assessment Total Assessment is a certain percentage of the fair market value that is determined by local assessors to be the total taxable value of land and additions on the property. | Land | Improvement |
|---|---|---|---|---|
| 2025 | $7,436 | $222,100 | $70,000 | $152,100 |
| 2024 | $7,187 | $222,100 | $70,000 | $152,100 |
| 2023 | $7,187 | $222,100 | $70,000 | $152,100 |
| 2022 | $7,116 | $222,100 | $70,000 | $152,100 |
| 2021 | $6,473 | $222,100 | $70,000 | $152,100 |
| 2020 | $6,818 | $222,100 | $70,000 | $152,100 |
| 2019 | $6,614 | $222,100 | $70,000 | $152,100 |
| 2018 | $6,432 | $222,100 | $70,000 | $152,100 |
| 2017 | $6,274 | $222,100 | $70,000 | $152,100 |
| 2016 | $7,622 | $254,900 | $75,000 | $179,900 |
| 2015 | $7,405 | $254,900 | $75,000 | $179,900 |
| 2014 | $7,104 | $254,900 | $75,000 | $179,900 |
Source: Public Records
Map
Nearby Homes
- 0 Harrisonville Rd Unit NJGL2065976
- 549 Clems Run
- 305 Fislerville Rd
- 101 Griffin Rd
- 4 Fawn Hollow Ln
- 730 Chickory Trail
- 0 Richwood Rd Unit NJGL2046570
- 0 Richwood Rd Unit NJGL2037568
- 403 Woodruff Trail
- 139 Sherwin Rd
- 487 3 Mullica Hill Rd
- 487 5 Mullica Hill Rd
- 487 4 Mullica Hill Rd
- 487 1 Mullica Hill Rd
- 487 2 Mullica Hill Rd
- 487 6 Mullica Hill Rd
- 205 Sherwin Rd
- 455 Mullica Hill Rd
- 211 Emerald Ln
- 337 Ewan Rd