Estimated Value: $458,422 - $502,000
3
Beds
3
Baths
2,207
Sq Ft
$216/Sq Ft
Est. Value
About This Home
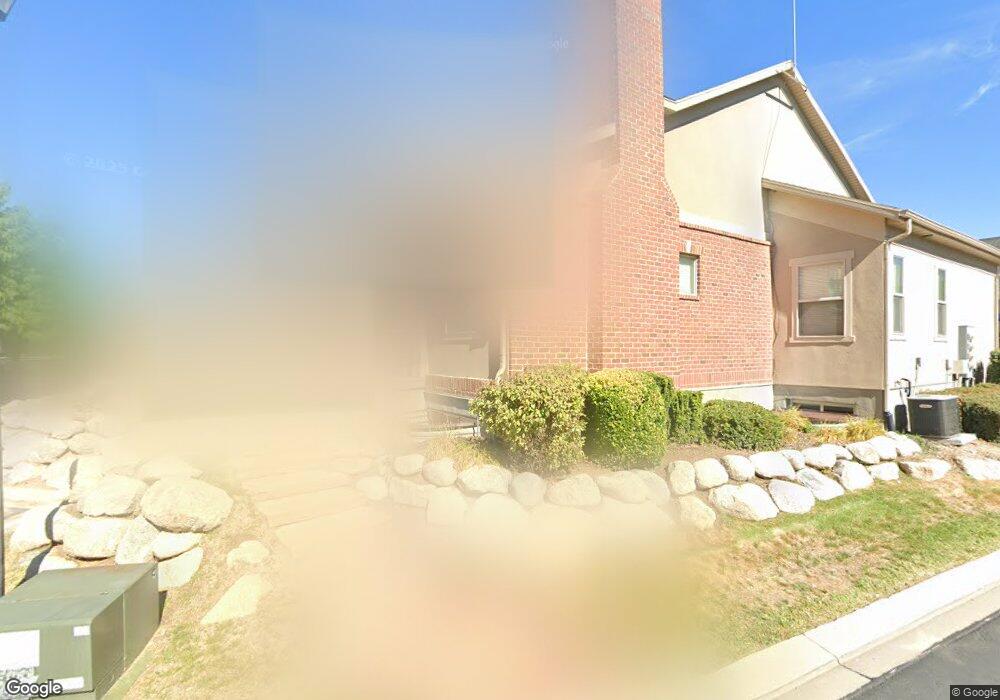
This home is located at 264 E Topspin Way, Lehi, UT 84043 and is currently estimated at $476,807, approximately $216 per square foot. 264 E Topspin Way is a home located in Utah County with nearby schools including Eaglecrest Elementary School, Lehi Junior High School, and Skyridge High School.
Ownership History
Date
Name
Owned For
Owner Type
Purchase Details
Closed on
Nov 20, 2020
Sold by
Loong James and Loong Shelly
Bought by
Meyer John
Current Estimated Value
Home Financials for this Owner
Home Financials are based on the most recent Mortgage that was taken out on this home.
Original Mortgage
$304,000
Outstanding Balance
$270,517
Interest Rate
2.8%
Mortgage Type
New Conventional
Estimated Equity
$206,290
Purchase Details
Closed on
Mar 13, 2015
Sold by
Neilson Corey
Bought by
Loong James and Loong Shelly
Home Financials for this Owner
Home Financials are based on the most recent Mortgage that was taken out on this home.
Original Mortgage
$168,750
Interest Rate
3.65%
Mortgage Type
New Conventional
Purchase Details
Closed on
Nov 24, 2009
Sold by
Ivory Towns Llc
Bought by
Neilson Corey
Home Financials for this Owner
Home Financials are based on the most recent Mortgage that was taken out on this home.
Original Mortgage
$209,401
Interest Rate
4.88%
Mortgage Type
FHA
Create a Home Valuation Report for This Property
The Home Valuation Report is an in-depth analysis detailing your home's value as well as a comparison with similar homes in the area
Home Values in the Area
Average Home Value in this Area
Purchase History
| Date | Buyer | Sale Price | Title Company |
|---|---|---|---|
| Meyer John | -- | Us Title Insurance Agency | |
| Loong James | -- | Cottonwood Title Ins Ag | |
| Neilson Corey | -- | Cottonwood Title | |
| Ivory Towns Llc | -- | Cottonwood Title Insurance A |
Source: Public Records
Mortgage History
| Date | Status | Borrower | Loan Amount |
|---|---|---|---|
| Open | Meyer John | $304,000 | |
| Previous Owner | Loong James | $168,750 | |
| Previous Owner | Neilson Corey | $209,401 |
Source: Public Records
Tax History
| Year | Tax Paid | Tax Assessment Tax Assessment Total Assessment is a certain percentage of the fair market value that is determined by local assessors to be the total taxable value of land and additions on the property. | Land | Improvement |
|---|---|---|---|---|
| 2025 | $2,038 | $240,295 | -- | -- |
| 2024 | $2,038 | $238,535 | $0 | $0 |
| 2023 | $1,837 | $233,365 | $0 | $0 |
| 2022 | $1,903 | $234,465 | $0 | $0 |
| 2021 | $1,721 | $320,500 | $48,100 | $272,400 |
| 2020 | $1,632 | $300,400 | $45,100 | $255,300 |
| 2019 | $1,532 | $293,100 | $44,000 | $249,100 |
| 2018 | $1,377 | $249,100 | $37,400 | $211,700 |
| 2017 | $1,327 | $127,600 | $0 | $0 |
| 2016 | $1,387 | $123,750 | $0 | $0 |
| 2015 | $1,461 | $123,750 | $0 | $0 |
| 2014 | $1,378 | $116,050 | $0 | $0 |
Source: Public Records
Map
Nearby Homes
- 173 E Forehand Ln
- 532 E 3270 N
- 242 W Glenbrittle Dr
- 4272 Braiken Ridge Dr Unit 105
- 3239 N 620 E
- 3368 N 700 E
- 4137 Conic Hill Dr Unit 133
- 389 W 3200 N
- 4142 Horton Way Unit 161
- 4142 E Horton Way
- 4132 Horton Way Unit 160
- 4164 Horton Way Unit 162
- 878 E 3050 N
- 68 Talisman Ave Unit 185
- 36 Talisman Ave Unit 186
- 95 Talisman Ave Unit 225
- 14 Talisman Ave Unit 187
- 71 Talisman Ave Unit 224
- 975 E 2850 N
- 5344 N Trail Side Ct
- 264 E Topspin Way Unit 100
- 268 E Topspin Way
- 258 E Topspin Way
- 254 E Topspin Way
- 241 E Crosscourt Way
- 282 E Backhand Ln
- 278 E Backhand Ln
- 274 E Backhand Ln
- 270 E Backhand Ln
- 235 E Crosscourt Way
- 279 E Clubview Ln
- 275 E Clubview Ln
- 283 E Clubview Ln
- 261 E Clubview Ln
- 240 E Topspin Way
- 255 E Clubview Ln
- 287 E Clubview Ln
- 227 E Crosscourt Way
- 291 E Clubview Ln
- 249 E Clubview Ln
Your Personal Tour Guide
Ask me questions while you tour the home.