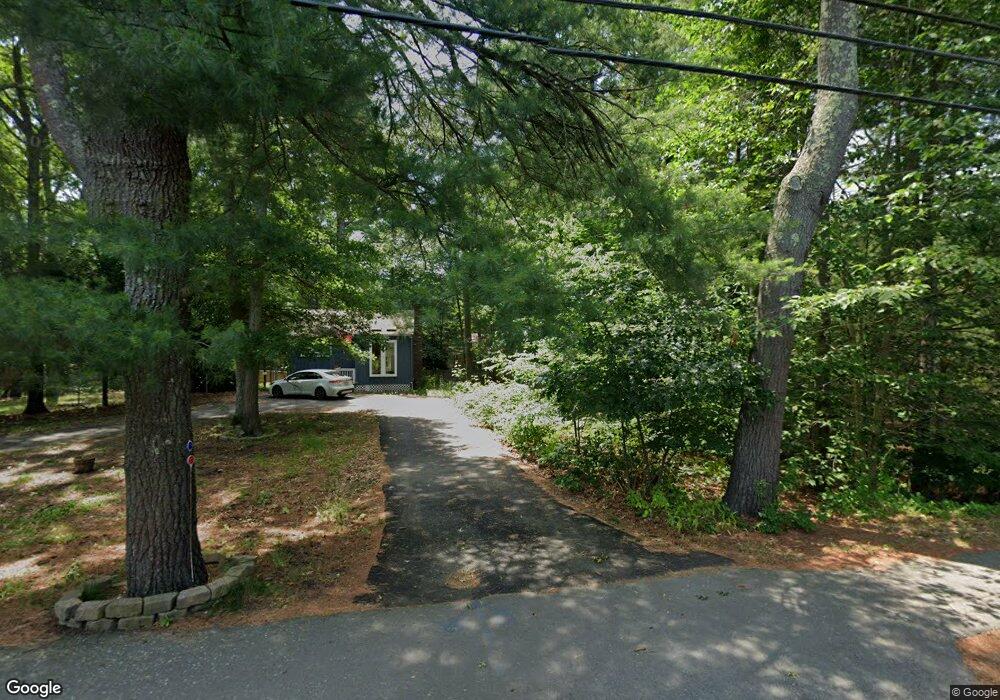
264 Flagg St Bridgewater, MA 02324
Estimated Value: $500,000 - $543,000
5
Beds
2
Baths
1,314
Sq Ft
$398/Sq Ft
Est. Value
About This Home
This home is located at 264 Flagg St, Bridgewater, MA 02324 and is currently estimated at $522,689, approximately $397 per square foot. 264 Flagg St is a home located in Plymouth County with nearby schools including Mitchell Elementary School, Williams Intermediate School, and Bridgewater Middle School.
Ownership History
Date
Name
Owned For
Owner Type
Purchase Details
Closed on
Aug 26, 2019
Sold by
Perewitz David L
Bought by
David L Perewitz T L and David Perewitz
Current Estimated Value
Purchase Details
Closed on
Jun 3, 2019
Sold by
Perewitz David L and Perewitz Susan M
Bought by
Perewitz David L
Purchase Details
Closed on
Nov 6, 1979
Bought by
Perewitz David L and Perewitz Susan M
Create a Home Valuation Report for This Property
The Home Valuation Report is an in-depth analysis detailing your home's value as well as a comparison with similar homes in the area
Home Values in the Area
Average Home Value in this Area
Purchase History
| Date | Buyer | Sale Price | Title Company |
|---|---|---|---|
| David L Perewitz T L | -- | -- | |
| Perewitz David L | -- | -- | |
| Perewitz David L | $53,900 | -- |
Source: Public Records
Mortgage History
| Date | Status | Borrower | Loan Amount |
|---|---|---|---|
| Previous Owner | Perewitz David L | $150,000 | |
| Previous Owner | Perewitz David L | $176,500 | |
| Previous Owner | Perewitz David L | $150,000 |
Source: Public Records
Tax History
| Year | Tax Paid | Tax Assessment Tax Assessment Total Assessment is a certain percentage of the fair market value that is determined by local assessors to be the total taxable value of land and additions on the property. | Land | Improvement |
|---|---|---|---|---|
| 2025 | $5,882 | $497,200 | $199,300 | $297,900 |
| 2024 | $5,725 | $471,600 | $189,800 | $281,800 |
| 2023 | $5,729 | $446,200 | $177,400 | $268,800 |
| 2022 | $5,638 | $393,700 | $155,600 | $238,100 |
| 2021 | $5,203 | $359,300 | $139,000 | $220,300 |
| 2020 | $5,113 | $347,100 | $133,600 | $213,500 |
| 2019 | $5,030 | $339,200 | $133,600 | $205,600 |
| 2018 | $4,852 | $319,400 | $129,700 | $189,700 |
| 2017 | $4,750 | $304,300 | $129,700 | $174,600 |
| 2016 | $4,544 | $292,400 | $127,200 | $165,200 |
| 2015 | $4,612 | $284,000 | $123,500 | $160,500 |
| 2014 | $4,505 | $277,200 | $119,800 | $157,400 |
Source: Public Records
Map
Nearby Homes
- 0 Flagg St Unit 73421818
- 35 Nelson Dr
- 1 Anacki Ln Unit 24
- 44 Titicut Ave Unit Lot 45
- 46 Titicut Ave
- 1 Jennifer Cir
- 101 Pratt Ave
- 17 Forbes Rd Unit Lot 64
- 73 Pratt Ave
- 220 Bedford St Unit 32
- 35 Leonard St Unit 3
- 120 Worcester St
- 51 Cottage St
- 65 Harvest Ln
- 35 Stockbridge Rd
- 30 Sanger St
- 0 Auburn St
- 0 Bedford St Unit 73480500
- 167 Spring St
- 118 Plesant St
Your Personal Tour Guide
Ask me questions while you tour the home.