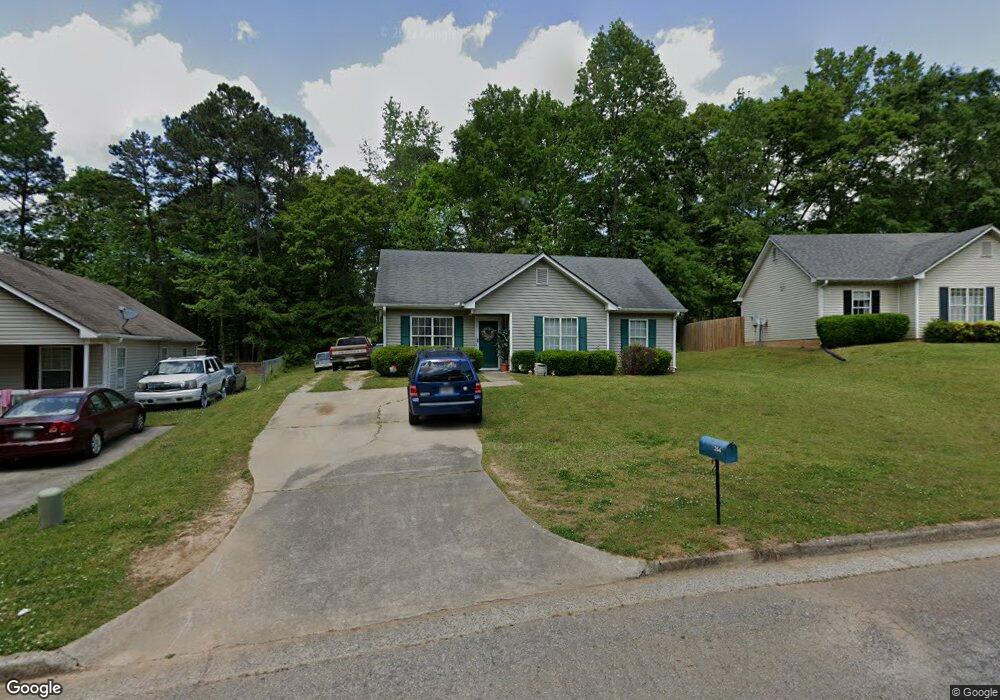
264 Griffith St Winder, GA 30680
Estimated Value: $245,000 - $276,000
3
Beds
2
Baths
1,122
Sq Ft
$233/Sq Ft
Est. Value
About This Home
This home is located at 264 Griffith St, Winder, GA 30680 and is currently estimated at $260,960, approximately $232 per square foot. 264 Griffith St is a home located in Barrow County with nearby schools including Holsenbeck Elementary School, Bear Creek Middle School, and Winder-Barrow High School.
Ownership History
Date
Name
Owned For
Owner Type
Purchase Details
Closed on
Aug 31, 2006
Sold by
Eckles Natasha
Bought by
Watson Cassandra T
Current Estimated Value
Home Financials for this Owner
Home Financials are based on the most recent Mortgage that was taken out on this home.
Original Mortgage
$87,120
Outstanding Balance
$51,231
Interest Rate
6.67%
Mortgage Type
New Conventional
Estimated Equity
$209,729
Purchase Details
Closed on
Apr 25, 2006
Sold by
Wachovia Bk
Bought by
Eckles Natasha
Home Financials for this Owner
Home Financials are based on the most recent Mortgage that was taken out on this home.
Original Mortgage
$78,750
Interest Rate
6.33%
Mortgage Type
New Conventional
Purchase Details
Closed on
Sep 7, 2004
Sold by
Mers Inc
Bought by
Fedl Natl Mtg Assn
Purchase Details
Closed on
Jan 28, 2002
Sold by
Foy Christopher D
Bought by
White E Elizabeth
Home Financials for this Owner
Home Financials are based on the most recent Mortgage that was taken out on this home.
Original Mortgage
$92,050
Interest Rate
7.14%
Mortgage Type
New Conventional
Purchase Details
Closed on
Jun 4, 1999
Sold by
Hunter-Frost Inc
Bought by
Foy Christopher D
Home Financials for this Owner
Home Financials are based on the most recent Mortgage that was taken out on this home.
Original Mortgage
$75,700
Interest Rate
6.94%
Mortgage Type
New Conventional
Create a Home Valuation Report for This Property
The Home Valuation Report is an in-depth analysis detailing your home's value as well as a comparison with similar homes in the area
Home Values in the Area
Average Home Value in this Area
Purchase History
| Date | Buyer | Sale Price | Title Company |
|---|---|---|---|
| Watson Cassandra T | $108,900 | -- | |
| Eckles Natasha | $83,800 | -- | |
| Wachovia Bk | -- | -- | |
| Fedl Natl Mtg Assn | -- | -- | |
| Mers Inc | $75,920 | -- | |
| White E Elizabeth | $94,000 | -- | |
| Foy Christopher D | $75,700 | -- |
Source: Public Records
Mortgage History
| Date | Status | Borrower | Loan Amount |
|---|---|---|---|
| Open | Watson Cassandra T | $87,120 | |
| Previous Owner | Wachovia Bk | $78,750 | |
| Previous Owner | White E Elizabeth | $92,050 | |
| Previous Owner | Foy Christopher D | $75,700 |
Source: Public Records
Tax History
| Year | Tax Paid | Tax Assessment Tax Assessment Total Assessment is a certain percentage of the fair market value that is determined by local assessors to be the total taxable value of land and additions on the property. | Land | Improvement |
|---|---|---|---|---|
| 2025 | $2,085 | $89,740 | $18,400 | $71,340 |
| 2024 | $2,080 | $87,526 | $18,400 | $69,126 |
| 2023 | $1,590 | $87,526 | $18,400 | $69,126 |
| 2022 | $1,694 | $56,144 | $18,400 | $37,744 |
| 2021 | $1,491 | $47,744 | $10,000 | $37,744 |
| 2020 | $1,462 | $47,744 | $10,000 | $37,744 |
| 2019 | $1,413 | $44,978 | $10,000 | $34,978 |
| 2018 | $1,014 | $30,364 | $8,000 | $22,364 |
| 2017 | $790 | $26,488 | $8,000 | $18,488 |
| 2016 | $780 | $26,701 | $8,000 | $18,701 |
| 2015 | $788 | $26,914 | $8,000 | $18,914 |
| 2014 | $685 | $24,614 | $5,488 | $19,126 |
| 2013 | -- | $23,501 | $5,488 | $18,013 |
Source: Public Records
Map
Nearby Homes
- 317 Georgia Ave
- 227 Martin Luther King jr Dr
- 324 E Broad St
- 208 Shields St
- 323 Lumpkin St
- 154 Blake Ln
- 131 Pinehurst Dr
- 40 Mimosa St
- 26 Hosch Cir
- 260 Westlyn Way
- 80 Shoal Ct
- 72 Shoal Ct
- 76 Shoal Ct
- 78 Shoal Ct
- 74 Shoal Ct
- 209 Georgia Ave
- 18 E New St
- 32 Saint Ives Cir Unit 2
- 160 N Broad St
- 163 Wood Cir
- 262 Griffith St
- 266 Griffith St
- 260 Griffith St
- 268 Griffith St
- 189 Highland Dr
- 185 Highland Dr
- 197 Highland Dr
- 193 Highland Dr
- 261 Griffith St
- 261 Griffith St Unit 15
- 181 Highland Dr
- 267 Griffith St
- 270 Griffith St
- 258 Griffith St
- 269 Griffith St
- 164 Folly St
- 199 Highland Dr
- 271 Griffith St
- 210 Highland Dr
- 254 Griffith St
Your Personal Tour Guide
Ask me questions while you tour the home.