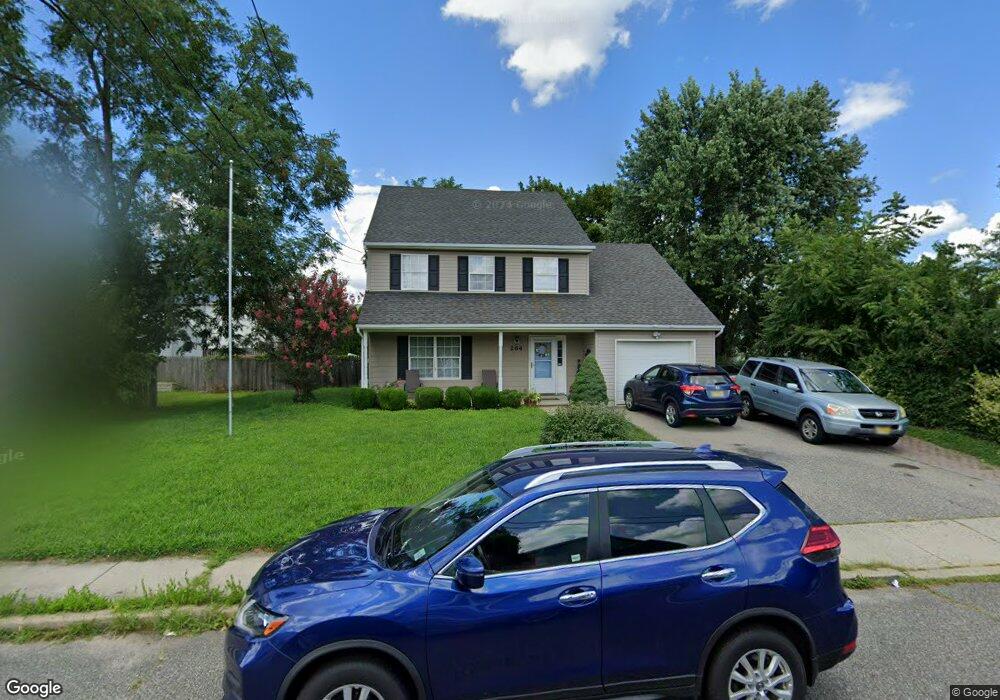
264 Hurley St Keyport, NJ 07735
Estimated Value: $595,000 - $615,000
4
Beds
3
Baths
1,773
Sq Ft
$342/Sq Ft
Est. Value
About This Home
This home is located at 264 Hurley St, Keyport, NJ 07735 and is currently estimated at $606,361, approximately $341 per square foot. 264 Hurley St is a home located in Monmouth County with nearby schools including Keyport Central School, Keyport High School, and Icob Academy.
Ownership History
Date
Name
Owned For
Owner Type
Purchase Details
Closed on
Nov 10, 2021
Sold by
Chan Mirla E and Chan Jun R
Bought by
Chan Mirla E and Chan Jun R
Current Estimated Value
Home Financials for this Owner
Home Financials are based on the most recent Mortgage that was taken out on this home.
Original Mortgage
$320,000
Outstanding Balance
$293,630
Interest Rate
3.09%
Mortgage Type
New Conventional
Estimated Equity
$312,731
Purchase Details
Closed on
Feb 7, 2017
Sold by
David Dondero
Bought by
Chan Mirla and Chan Jun
Home Financials for this Owner
Home Financials are based on the most recent Mortgage that was taken out on this home.
Original Mortgage
$314,694
Interest Rate
4.19%
Purchase Details
Closed on
Oct 14, 2003
Sold by
Devino Robert
Bought by
Dondero David
Home Financials for this Owner
Home Financials are based on the most recent Mortgage that was taken out on this home.
Original Mortgage
$242,000
Interest Rate
5.82%
Purchase Details
Closed on
Oct 8, 2002
Sold by
Monmouth Rehabs Inc
Bought by
Devino Robert and Jackiewicz Chester
Home Financials for this Owner
Home Financials are based on the most recent Mortgage that was taken out on this home.
Original Mortgage
$166,250
Interest Rate
6.03%
Create a Home Valuation Report for This Property
The Home Valuation Report is an in-depth analysis detailing your home's value as well as a comparison with similar homes in the area
Home Values in the Area
Average Home Value in this Area
Purchase History
| Date | Buyer | Sale Price | Title Company |
|---|---|---|---|
| Chan Mirla E | -- | Fit Agency Llc | |
| Chan Mirla E | -- | None Listed On Document | |
| Chan Mirla | -- | -- | |
| Dondero David | $302,500 | -- | |
| Devino Robert | $55,000 | -- |
Source: Public Records
Mortgage History
| Date | Status | Borrower | Loan Amount |
|---|---|---|---|
| Open | Chan Mirla E | $320,000 | |
| Closed | Chan Mirla E | $320,000 | |
| Previous Owner | Chan Mirla | $314,694 | |
| Previous Owner | Chan Mirla | -- | |
| Previous Owner | Dondero David | $242,000 | |
| Previous Owner | Devino Robert | $166,250 |
Source: Public Records
Tax History Compared to Growth
Tax History
| Year | Tax Paid | Tax Assessment Tax Assessment Total Assessment is a certain percentage of the fair market value that is determined by local assessors to be the total taxable value of land and additions on the property. | Land | Improvement |
|---|---|---|---|---|
| 2025 | $9,284 | $489,500 | $207,900 | $281,600 |
| 2024 | $9,816 | $448,500 | $180,800 | $267,700 |
| 2023 | $9,816 | $446,600 | $164,400 | $282,200 |
| 2022 | $9,008 | $391,300 | $142,900 | $248,400 |
| 2021 | $9,008 | $356,900 | $132,300 | $224,600 |
| 2020 | $8,812 | $346,500 | $127,700 | $218,800 |
| 2019 | $8,635 | $340,100 | $123,300 | $216,800 |
| 2018 | $8,398 | $323,000 | $142,800 | $180,200 |
| 2017 | $8,285 | $317,800 | $137,800 | $180,000 |
| 2016 | $8,652 | $300,000 | $137,800 | $162,200 |
| 2015 | $8,290 | $319,200 | $122,800 | $196,400 |
| 2014 | $7,981 | $310,300 | $97,800 | $212,500 |
Source: Public Records
Map
Nearby Homes
- 268 Hurley St
- 26 Van Dorn St
- 213 Atlantic St
- 212 Atlantic St
- 210 Atlantic St
- 24 Van Dorn St
- 207 Atlantic St
- 11-4 Hurley St
- 22 Van Dorn St
- 11-3 Hurley St
- 11-5 Hurley St
- 45 Van Dorn St
- 20 Van Dorn St
- 11-2 Hurley St
- 11-1 Hurley St
- 43 Van Dorn St
- 17 Hurley St
- 18 Van Dorn St
- 11 Hurley St
- 11 Hurley St Unit 4