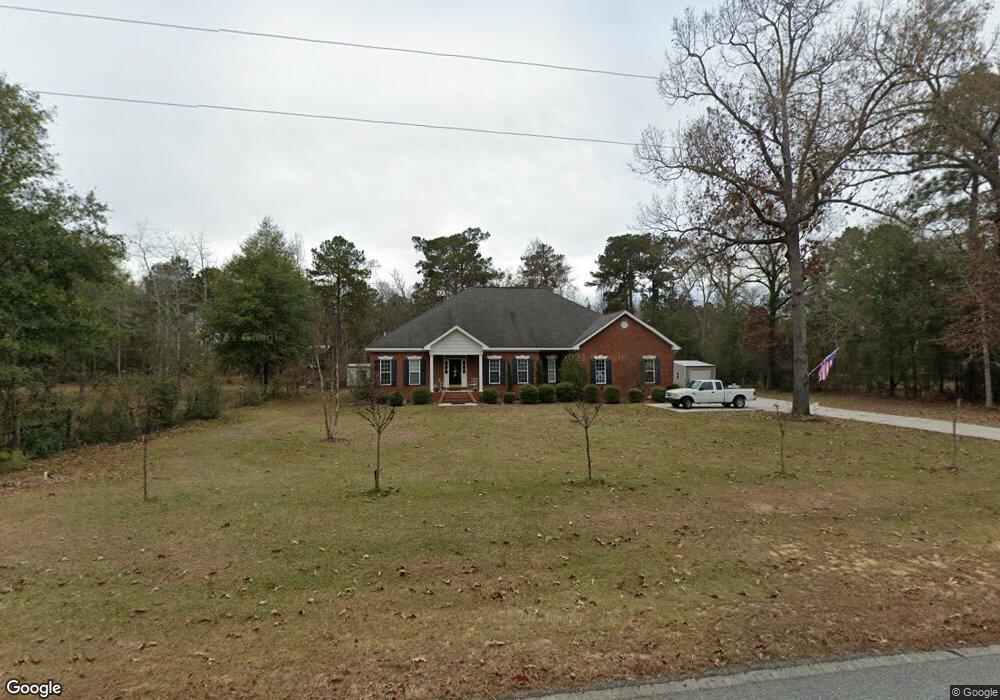
264 Hurt Dr Cordele, GA 31015
Estimated Value: $359,000 - $502,000
3
Beds
3
Baths
2,705
Sq Ft
$164/Sq Ft
Est. Value
About This Home
This home is located at 264 Hurt Dr, Cordele, GA 31015 and is currently estimated at $444,887, approximately $164 per square foot. 264 Hurt Dr is a home located in Crisp County with nearby schools including Crisp County Elementary School, Crisp County Primary School, and Crisp County Middle School.
Ownership History
Date
Name
Owned For
Owner Type
Purchase Details
Closed on
Dec 1, 2014
Sold by
Rigdon Nancy P
Bought by
Booth Kenneth Eugene and Booth Brenda D
Current Estimated Value
Purchase Details
Closed on
Apr 6, 2009
Sold by
Rigdon Nancy P
Bought by
Rigdon Nancy P
Home Financials for this Owner
Home Financials are based on the most recent Mortgage that was taken out on this home.
Original Mortgage
$162,000
Interest Rate
5.18%
Mortgage Type
New Conventional
Purchase Details
Closed on
Mar 29, 2007
Sold by
Rigdon Nancy P
Bought by
Rigdon James W and Rigdon Nancy P
Purchase Details
Closed on
Sep 13, 2006
Sold by
Ragan Roy Anthony
Bought by
Rigdon Nancy P
Purchase Details
Closed on
Apr 12, 1999
Sold by
Hurt W Charles
Bought by
Ragan Roy Anthony
Purchase Details
Closed on
Feb 23, 1990
Sold by
Hurt W Charles
Bought by
Ragan Roy Anthony
Purchase Details
Closed on
Mar 2, 1976
Bought by
Hurt W Charles
Create a Home Valuation Report for This Property
The Home Valuation Report is an in-depth analysis detailing your home's value as well as a comparison with similar homes in the area
Home Values in the Area
Average Home Value in this Area
Purchase History
| Date | Buyer | Sale Price | Title Company |
|---|---|---|---|
| Booth Kenneth Eugene | $225,000 | -- | |
| Rigdon Nancy P | -- | -- | |
| Rigdon James W | -- | -- | |
| Rigdon Nancy P | $22,000 | -- | |
| Ragan Roy Anthony | $5,200 | -- | |
| Ragan Roy Anthony | -- | -- | |
| Hurt W Charles | -- | -- |
Source: Public Records
Mortgage History
| Date | Status | Borrower | Loan Amount |
|---|---|---|---|
| Previous Owner | Rigdon Nancy P | $162,000 |
Source: Public Records
Tax History Compared to Growth
Tax History
| Year | Tax Paid | Tax Assessment Tax Assessment Total Assessment is a certain percentage of the fair market value that is determined by local assessors to be the total taxable value of land and additions on the property. | Land | Improvement |
|---|---|---|---|---|
| 2024 | $2,573 | $110,320 | $8,881 | $101,439 |
| 2023 | $2,591 | $107,709 | $8,881 | $98,828 |
| 2022 | $2,511 | $104,881 | $7,105 | $97,776 |
| 2021 | $2,942 | $99,227 | $7,105 | $92,122 |
| 2020 | $2,484 | $99,227 | $7,105 | $92,122 |
| 2019 | $2,466 | $99,227 | $7,105 | $92,122 |
| 2018 | $2,382 | $93,463 | $5,800 | $87,663 |
| 2017 | $2,874 | $93,463 | $5,800 | $87,663 |
| 2016 | $2,389 | $93,463 | $5,800 | $87,663 |
| 2015 | -- | $92,091 | $5,800 | $86,291 |
| 2014 | -- | $92,091 | $5,800 | $86,291 |
| 2013 | -- | $92,090 | $5,800 | $86,290 |
Source: Public Records
Map
Nearby Homes
- 120 Cove Rd
- 620 Lakeshore Dr
- 199 Hurt Dr
- 480 Spring Creek Rd
- 484 Spring Creek Rd
- 636 Spring Creek Rd
- 1022 Flournoy Rd
- 888 Flournoy Rd
- 484 Lakeshore Way
- Lot 15 Georgia-Florida Pkwy
- 0 Power Dam Rd
- 118 Swift Creek Rd
- 0 Swift Creek Rd Unit 138425
- 129 Main St NW
- 144 Bryant Rd
- 198 Swift Creek Rd
- 0 Washington St SE
- 000 Lakeshore Way
- 102 Perch Dr
- 0 Arabi Warwick Rd