264 Luce Rd Readfield, ME 04355
Estimated Value: $287,000 - $407,000
3
Beds
1
Bath
1,176
Sq Ft
$286/Sq Ft
Est. Value
About This Home
This home is located at 264 Luce Rd, Readfield, ME 04355 and is currently estimated at $336,700, approximately $286 per square foot. 264 Luce Rd is a home located in Kennebec County.
Ownership History
Date
Name
Owned For
Owner Type
Purchase Details
Closed on
Oct 9, 2020
Sold by
Maddocks Jason R
Bought by
Maddocks Nicole L
Current Estimated Value
Home Financials for this Owner
Home Financials are based on the most recent Mortgage that was taken out on this home.
Original Mortgage
$36,000
Outstanding Balance
$31,519
Interest Rate
2.8%
Mortgage Type
New Conventional
Estimated Equity
$305,181
Create a Home Valuation Report for This Property
The Home Valuation Report is an in-depth analysis detailing your home's value as well as a comparison with similar homes in the area
Home Values in the Area
Average Home Value in this Area
Purchase History
We collect this data history from publicly available records. To have your information removed, we recommend requesting removal directly through your county’s website.
| Date | Buyer | Sale Price | Title Company |
|---|---|---|---|
| Maddocks Nicole L | -- | None Available |
Source: Public Records
Mortgage History
We collect this data history from publicly available records. To have your information removed, we recommend requesting removal directly through your county’s website.
| Date | Status | Borrower | Loan Amount |
|---|---|---|---|
| Open | Maddocks Nicole L | $36,000 |
Source: Public Records
Tax History
| Year | Tax Paid | Tax Assessment Tax Assessment Total Assessment is a certain percentage of the fair market value that is determined by local assessors to be the total taxable value of land and additions on the property. | Land | Improvement |
|---|---|---|---|---|
| 2025 | $3,484 | $288,900 | $33,700 | $255,200 |
| 2024 | $3,360 | $250,900 | $29,300 | $221,600 |
| 2023 | $3,121 | $220,400 | $25,700 | $194,700 |
| 2022 | $2,254 | $197,700 | $23,100 | $174,600 |
| 2021 | $2,882 | $182,500 | $21,300 | $161,200 |
| 2020 | $2,938 | $167,200 | $19,500 | $147,700 |
| 2019 | $2,974 | $152,100 | $17,800 | $134,300 |
| 2018 | $2,957 | $152,100 | $17,800 | $134,300 |
| 2017 | $2,934 | $152,100 | $17,800 | $134,300 |
| 2015 | $2,750 | $152,100 | $17,800 | $134,300 |
| 2014 | $2,814 | $152,100 | $17,800 | $134,300 |
Source: Public Records
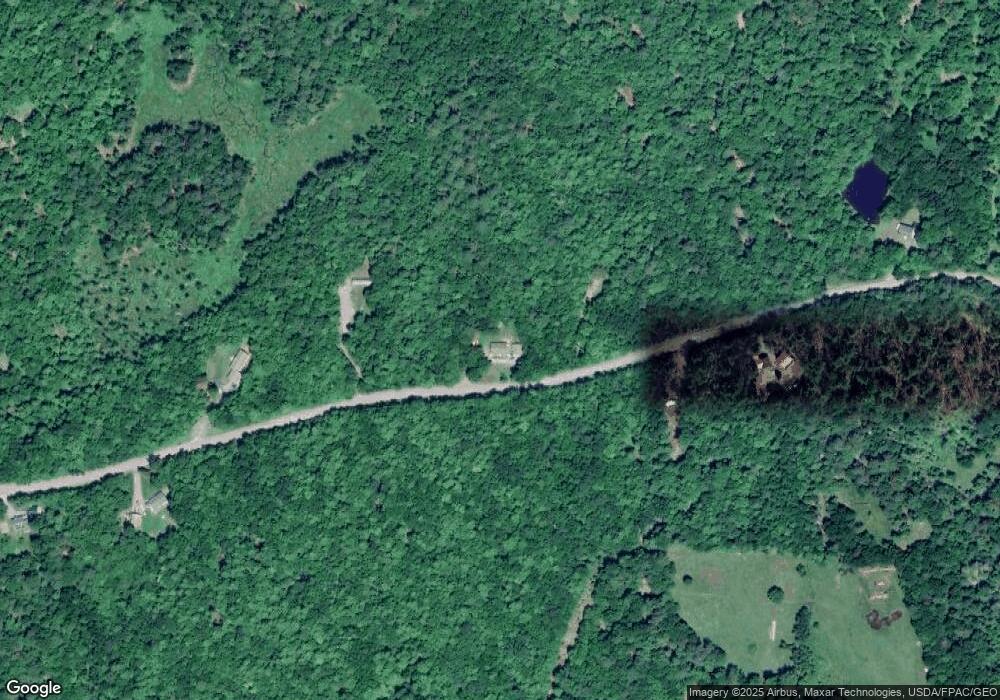
Map
Nearby Homes
- 0 North Rd
- 705 Plains Rd
- 35 Fire Road Dc-1
- 26 Fire Road Dc-1
- 548 North Rd
- 32 Roddy Ln
- 123 Fogg Rd
- 90 Macomber Rd
- 283 Church Rd
- 10 Song Bird Ln
- Lot 3A1 Prescott Rd
- TBD Bartlett Rd
- 155 Old Kents Hill Rd
- M107, L3 Chase Rd
- 37 Torsey Shores Rd
- 36 Mountain View Ln
- 246 Carlton Pond Rd
- 23 Cove Rd
- Lot 2 Marble Point Rd
- Lot 9-18 Deer Run
Your Personal Tour Guide
Ask me questions while you tour the home.