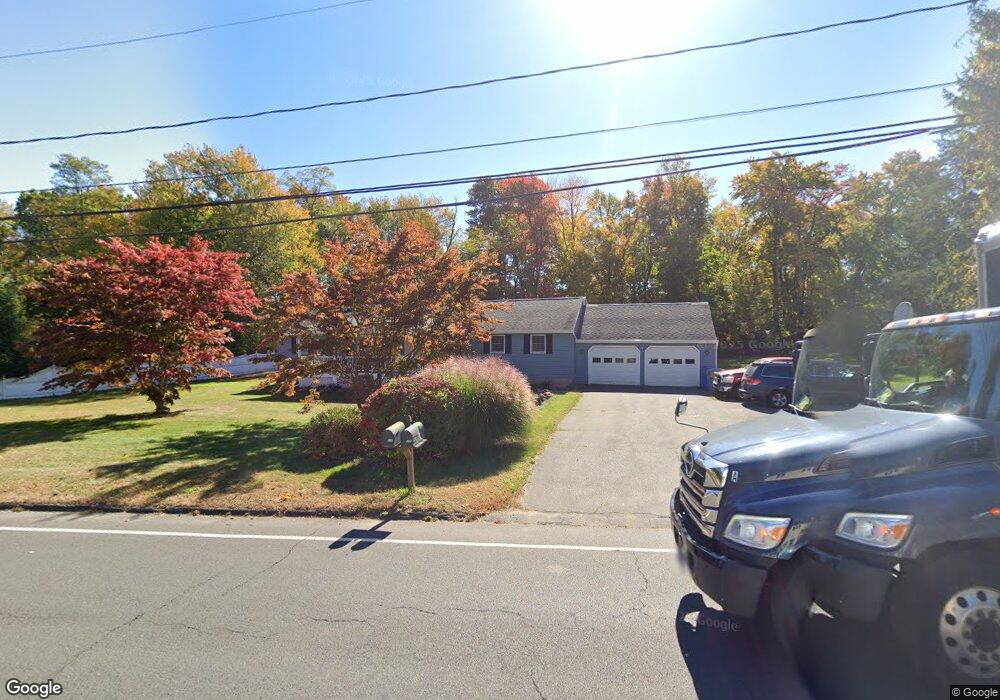
264 Mine Rd Bristol, CT 06010
North Bristol NeighborhoodEstimated Value: $340,000 - $458,000
3
Beds
2
Baths
2,438
Sq Ft
$163/Sq Ft
Est. Value
About This Home
This home is located at 264 Mine Rd, Bristol, CT 06010 and is currently estimated at $396,550, approximately $162 per square foot. 264 Mine Rd is a home located in Hartford County with nearby schools including Ivy Drive School, Northeast Middle School, and Bristol Eastern High School.
Ownership History
Date
Name
Owned For
Owner Type
Purchase Details
Closed on
Jul 23, 1993
Sold by
Dime Sb Ny
Bought by
Gorneault Sylva S
Current Estimated Value
Home Financials for this Owner
Home Financials are based on the most recent Mortgage that was taken out on this home.
Original Mortgage
$91,800
Interest Rate
7.43%
Mortgage Type
Unknown
Purchase Details
Closed on
Aug 1, 1988
Sold by
Norton John F
Bought by
Roberts John O
Home Financials for this Owner
Home Financials are based on the most recent Mortgage that was taken out on this home.
Original Mortgage
$116,800
Interest Rate
10.39%
Create a Home Valuation Report for This Property
The Home Valuation Report is an in-depth analysis detailing your home's value as well as a comparison with similar homes in the area
Home Values in the Area
Average Home Value in this Area
Purchase History
| Date | Buyer | Sale Price | Title Company |
|---|---|---|---|
| Gorneault Sylva S | $102,000 | -- | |
| Roberts John O | $146,000 | -- |
Source: Public Records
Mortgage History
| Date | Status | Borrower | Loan Amount |
|---|---|---|---|
| Closed | Roberts John O | $91,800 | |
| Previous Owner | Roberts John O | $116,800 | |
| Previous Owner | Roberts John O | $25,000 | |
| Previous Owner | Roberts John O | $5,000 |
Source: Public Records
Tax History Compared to Growth
Tax History
| Year | Tax Paid | Tax Assessment Tax Assessment Total Assessment is a certain percentage of the fair market value that is determined by local assessors to be the total taxable value of land and additions on the property. | Land | Improvement |
|---|---|---|---|---|
| 2025 | $6,894 | $204,260 | $58,940 | $145,320 |
| 2024 | $6,506 | $204,260 | $58,940 | $145,320 |
| 2023 | $6,131 | $202,020 | $58,940 | $143,080 |
| 2022 | $5,305 | $138,320 | $40,950 | $97,370 |
| 2021 | $5,007 | $130,550 | $40,950 | $89,600 |
| 2020 | $5,007 | $130,550 | $40,950 | $89,600 |
| 2019 | $4,967 | $130,550 | $40,950 | $89,600 |
| 2018 | $4,815 | $130,550 | $40,950 | $89,600 |
| 2017 | $5,130 | $142,380 | $58,520 | $83,860 |
| 2016 | $5,130 | $142,380 | $58,520 | $83,860 |
| 2015 | $4,928 | $142,380 | $58,520 | $83,860 |
| 2014 | $4,928 | $142,380 | $58,520 | $83,860 |
Source: Public Records
Map
Nearby Homes