Estimated Value: $357,000 - $521,000
5
Beds
2
Baths
2,387
Sq Ft
$180/Sq Ft
Est. Value
About This Home
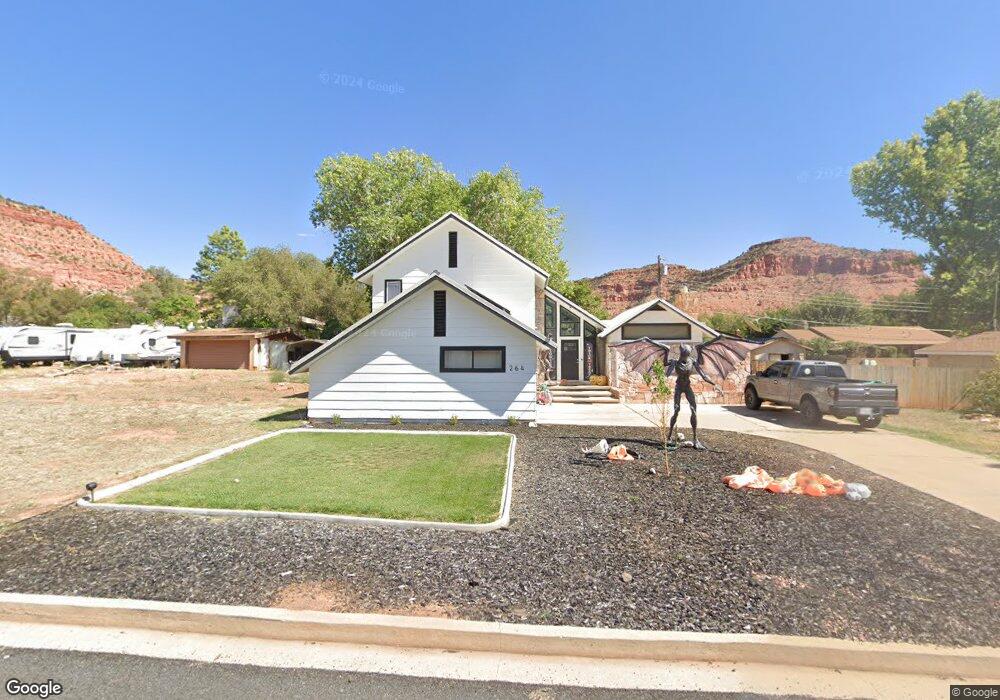
This home is located at 264 N 150 E, Kanab, UT 84741 and is currently estimated at $428,490, approximately $179 per square foot. 264 N 150 E is a home located in Kane County with nearby schools including Kanab Elementary School, Kanab Middle School, and Kanab High School.
Ownership History
Date
Name
Owned For
Owner Type
Purchase Details
Closed on
Jan 5, 2021
Sold by
Brown David L
Bought by
Cram Hunter L and Cram Celeste
Current Estimated Value
Purchase Details
Closed on
Mar 2, 2015
Sold by
Clare Clare and Poulsen Clare Leroy
Bought by
Poulsen Clare L and Poulsen Carrie S
Home Financials for this Owner
Home Financials are based on the most recent Mortgage that was taken out on this home.
Original Mortgage
$166,938
Interest Rate
3.61%
Mortgage Type
Purchase Money Mortgage
Purchase Details
Closed on
Dec 23, 2013
Sold by
Norris James A and Norris Margery F
Bought by
Poulsen Clare and Poulsen Carrie
Home Financials for this Owner
Home Financials are based on the most recent Mortgage that was taken out on this home.
Original Mortgage
$163,265
Interest Rate
4.17%
Mortgage Type
New Conventional
Purchase Details
Closed on
Jun 9, 2005
Sold by
Brown David L and Brown Gwen S
Bought by
Norris James A and Norris Margery F
Create a Home Valuation Report for This Property
The Home Valuation Report is an in-depth analysis detailing your home's value as well as a comparison with similar homes in the area
Home Values in the Area
Average Home Value in this Area
Purchase History
| Date | Buyer | Sale Price | Title Company |
|---|---|---|---|
| Cram Hunter L | -- | -- | |
| Poulsen Clare L | -- | -- | |
| Poulsen Clare | -- | -- | |
| Norris James A | -- | -- |
Source: Public Records
Mortgage History
| Date | Status | Borrower | Loan Amount |
|---|---|---|---|
| Previous Owner | Poulsen Clare L | $166,938 | |
| Previous Owner | Poulsen Clare | $163,265 |
Source: Public Records
Tax History
| Year | Tax Paid | Tax Assessment Tax Assessment Total Assessment is a certain percentage of the fair market value that is determined by local assessors to be the total taxable value of land and additions on the property. | Land | Improvement |
|---|---|---|---|---|
| 2025 | $2,066 | $437,834 | $108,824 | $329,010 |
| 2024 | $2,136 | $248,200 | $49,384 | $198,816 |
| 2023 | $1,913 | $227,775 | $47,033 | $180,742 |
| 2022 | $1,700 | $200,489 | $36,179 | $164,310 |
| 2021 | $1,537 | $271,893 | $50,600 | $221,293 |
| 2020 | $1,487 | $255,424 | $46,000 | $209,424 |
| 2019 | $1,375 | $229,997 | $45,540 | $184,457 |
| 2018 | $1,341 | $222,407 | $37,950 | $184,457 |
| 2017 | $1,273 | $201,620 | $34,500 | $167,120 |
| 2016 | $1,130 | $173,717 | $34,500 | $139,217 |
| 2015 | $1,070 | $160,884 | $34,500 | $126,384 |
| 2014 | $1,070 | $163,690 | $36,960 | $126,730 |
| 2013 | -- | $90,030 | $0 | $0 |
Source: Public Records
Map
Nearby Homes
- 238 E 330 N
- 236 200
- 300 E 300 N Unit A3
- 300 E 300 N Unit A8
- 300 E 300 N Unit H6
- 320 W Los Barancos Ln
- 61 W 200 N
- 281 W Ladera Ln
- 190 W Ladera Ln
- 70 N Main St
- 297 N 100 W
- 444 Ladera Ln
- 463 E Deadwood Dr
- 484 E Mohawk Dr
- 35 N 100 W
- 163 N 200 W
- 197 N 200 W
- 493 E Donner Cir
- 587 E El Valle Dr
- 0 100 Unit 1409231
Your Personal Tour Guide
Ask me questions while you tour the home.