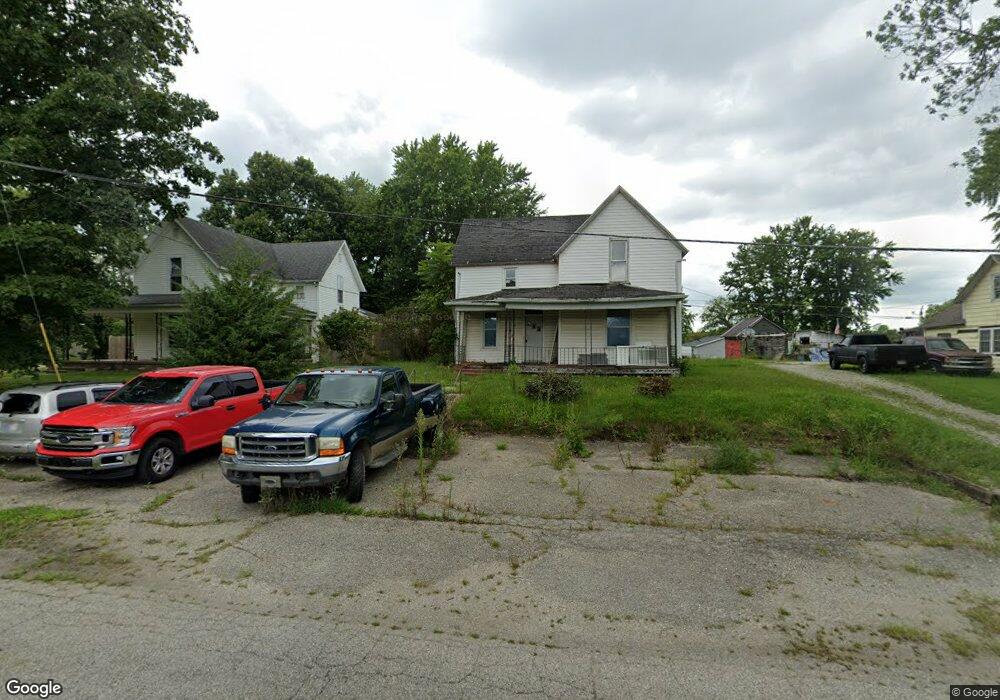
264 N Elm St Bunker Hill, IN 46914
Estimated Value: $99,000 - $132,000
4
Beds
1
Bath
2,688
Sq Ft
$42/Sq Ft
Est. Value
About This Home
This home is located at 264 N Elm St, Bunker Hill, IN 46914 and is currently estimated at $112,674, approximately $41 per square foot. 264 N Elm St is a home located in Miami County with nearby schools including Pipe Creek Elementary School, Maconaquah Elementary School, and Maconaquah Middle School.
Ownership History
Date
Name
Owned For
Owner Type
Purchase Details
Closed on
Feb 15, 2019
Sold by
Odell Nationwide Llc
Bought by
Princeton Legacy Llc
Current Estimated Value
Purchase Details
Closed on
Sep 12, 2016
Sold by
Usara Llc
Bought by
Odell Nationwide Llc
Purchase Details
Closed on
Aug 31, 2016
Sold by
Deutsche Bank National Trust Co
Bought by
Usara Llc
Purchase Details
Closed on
Apr 19, 2016
Sold by
Ramberger Denise M and Ramberger Chris A
Bought by
Deutsche Bank National Trust Co
Create a Home Valuation Report for This Property
The Home Valuation Report is an in-depth analysis detailing your home's value as well as a comparison with similar homes in the area
Home Values in the Area
Average Home Value in this Area
Purchase History
| Date | Buyer | Sale Price | Title Company |
|---|---|---|---|
| Princeton Legacy Llc | $15,504 | None Available | |
| Odell Nationwide Llc | $8,500 | None Available | |
| Usara Llc | $8,500 | None Available | |
| Deutsche Bank National Trust Co | $34,000 | None Available |
Source: Public Records
Tax History Compared to Growth
Tax History
| Year | Tax Paid | Tax Assessment Tax Assessment Total Assessment is a certain percentage of the fair market value that is determined by local assessors to be the total taxable value of land and additions on the property. | Land | Improvement |
|---|---|---|---|---|
| 2024 | $1,080 | $54,000 | $7,400 | $46,600 |
| 2023 | $1,080 | $54,600 | $7,400 | $47,200 |
| 2022 | $1,100 | $54,600 | $7,400 | $47,200 |
| 2021 | $1,289 | $64,100 | $7,400 | $56,700 |
| 2020 | $1,289 | $64,100 | $7,400 | $56,700 |
| 2019 | $1,289 | $64,100 | $7,400 | $56,700 |
| 2018 | $1,067 | $53,000 | $7,400 | $45,600 |
| 2017 | $1,055 | $52,400 | $7,300 | $45,100 |
| 2016 | $321 | $52,200 | $7,300 | $44,900 |
| 2014 | $190 | $51,500 | $7,300 | $44,200 |
| 2013 | -- | $51,300 | $7,300 | $44,000 |
Source: Public Records
Map
Nearby Homes
- 2361 W Broadway
- Elm Street S 1100 St S
- 1758 N Lancer St
- 6559 S Abbi Ct
- 4608 S 100 W
- 9934 S 150 W
- 2031 Shaw Ave
- 4189 U S 31
- 3001 March St
- 1352 W 400 S
- 3210 Schilling St
- 2042 W 400 S
- 39033 Edwards Ct
- 2940 W 400 S
- 4364 W 500 S
- 3047 S Wallick Rd
- Lot 15 W Barberry Ln
- Lot 14 W Barberry Ln Unit 14
- 2893 S Us Route 31
- 2763 S Wallick Rd