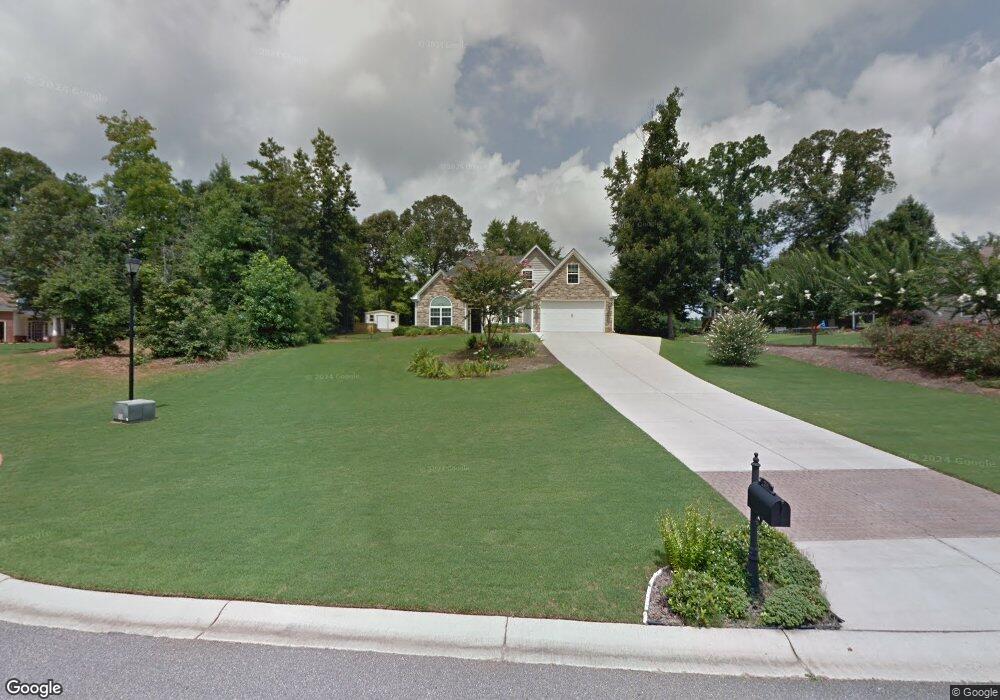
264 Palmer Ct Jefferson, GA 30549
Estimated Value: $403,152 - $511,000
--
Bed
3
Baths
2,260
Sq Ft
$196/Sq Ft
Est. Value
About This Home
This home is located at 264 Palmer Ct, Jefferson, GA 30549 and is currently estimated at $443,038, approximately $196 per square foot. 264 Palmer Ct is a home located in Jackson County with nearby schools including South Jackson Elementary School, East Jackson Middle School, and East Jackson Comprehensive High School.
Ownership History
Date
Name
Owned For
Owner Type
Purchase Details
Closed on
Feb 14, 2006
Sold by
Not Provided
Bought by
Hallford John David and Hallford Wendy L
Current Estimated Value
Home Financials for this Owner
Home Financials are based on the most recent Mortgage that was taken out on this home.
Original Mortgage
$192,873
Outstanding Balance
$107,548
Interest Rate
6.04%
Mortgage Type
FHA
Estimated Equity
$335,490
Purchase Details
Closed on
Mar 10, 2005
Sold by
Georgia Land & Erosion Llc
Bought by
Classic Custom Homes
Home Financials for this Owner
Home Financials are based on the most recent Mortgage that was taken out on this home.
Original Mortgage
$154,954
Interest Rate
5.54%
Mortgage Type
New Conventional
Purchase Details
Closed on
Feb 18, 2004
Sold by
Georgia Power Co
Bought by
Georgia Land & Erosion Llc
Purchase Details
Closed on
Dec 3, 2003
Sold by
Francis Palmer Estate
Bought by
Georgia Land & Erosion Llc
Create a Home Valuation Report for This Property
The Home Valuation Report is an in-depth analysis detailing your home's value as well as a comparison with similar homes in the area
Home Values in the Area
Average Home Value in this Area
Purchase History
| Date | Buyer | Sale Price | Title Company |
|---|---|---|---|
| Hallford John David | $195,900 | -- | |
| Classic Custom Homes | $35,300 | -- | |
| Georgia Land & Erosion Llc | -- | -- | |
| Georgia Land & Erosion Llc | $127,500 | -- |
Source: Public Records
Mortgage History
| Date | Status | Borrower | Loan Amount |
|---|---|---|---|
| Open | Hallford John David | $192,873 | |
| Previous Owner | Classic Custom Homes | $154,954 |
Source: Public Records
Tax History Compared to Growth
Tax History
| Year | Tax Paid | Tax Assessment Tax Assessment Total Assessment is a certain percentage of the fair market value that is determined by local assessors to be the total taxable value of land and additions on the property. | Land | Improvement |
|---|---|---|---|---|
| 2024 | $3,763 | $147,400 | $18,000 | $129,400 |
| 2023 | $3,750 | $131,160 | $18,000 | $113,160 |
| 2022 | $3,160 | $111,840 | $18,000 | $93,840 |
| 2021 | $2,892 | $101,840 | $8,000 | $93,840 |
| 2020 | $2,697 | $86,960 | $8,000 | $78,960 |
| 2019 | $2,738 | $86,960 | $8,000 | $78,960 |
| 2018 | $2,742 | $85,920 | $8,000 | $77,920 |
| 2017 | $2,603 | $80,997 | $8,000 | $72,997 |
| 2016 | $2,618 | $80,997 | $8,000 | $72,997 |
| 2015 | $2,630 | $80,997 | $8,000 | $72,997 |
| 2014 | $1,852 | $57,169 | $8,000 | $49,169 |
| 2013 | -- | $57,169 | $8,000 | $49,169 |
Source: Public Records
Map
Nearby Homes
- 22 Creek Side Ct
- 474 Davis Rd
- 538 Davis Rd
- 570 Davis Rd
- 604 Davis Rd
- 1211 Sterling Lake Dr
- 642 Canter Way
- 860 Canter Way
- 939 Canter Way
- 77 Lakeview Ct
- 242 Carriage Ave
- Roswell w/ Basement Plan at Jefferson Hills
- Roswell Plan at Jefferson Hills
- Portland Plan at Jefferson Hills
- Portland w/ Basement Plan at Jefferson Hills
- Boston w/ Basement Plan at Jefferson Hills
- Atlanta Plan at Jefferson Hills
- Boston Plan at Jefferson Hills
- 73 Elijah St
- 139 Anglin Rd
- 238 Palmer Ct
- 278 Palmer Ct
- 284 Palmer Ct
- 283 Palmer Ct
- 194 Palmer Ct
- 201 Palmer Ct
- 336 Rambler Inn Rd
- 176 Palmer Ct
- 11 Ridgewood Rd
- 302 Rambler Inn Rd
- 378 Rambler Inn Rd
- 424 Rambler Inn Rd
- 21 Ridgewood Rd
- 120 Palmer Ct
- 264 Rambler Inn Rd
- 111 Palmer Ct
- 20 Ridgewood Rd
- 20 Ridgewood Rd Unit 6
- 222 Rambler Inn Rd
- 70 Davis Rd