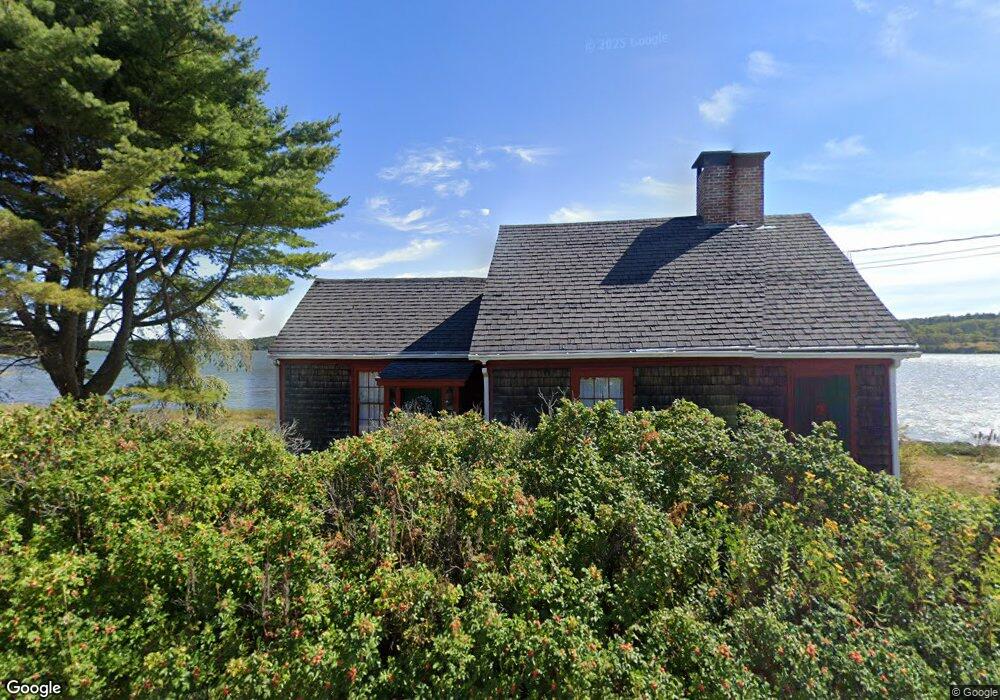
264 Port Rd MacHiasport, ME 04655
Estimated Value: $182,000 - $276,000
2
Beds
1
Bath
1,115
Sq Ft
$198/Sq Ft
Est. Value
About This Home
This home is located at 264 Port Rd, MacHiasport, ME 04655 and is currently estimated at $221,296, approximately $198 per square foot. 264 Port Rd is a home with nearby schools including Fort O'Brien School, Machias Valley Christian School, and Washington Academy.
Ownership History
Date
Name
Owned For
Owner Type
Purchase Details
Closed on
Oct 7, 2005
Sold by
Pettegrow Nancy M Est
Bought by
Stanley Edward M
Current Estimated Value
Create a Home Valuation Report for This Property
The Home Valuation Report is an in-depth analysis detailing your home's value as well as a comparison with similar homes in the area
Home Values in the Area
Average Home Value in this Area
Purchase History
| Date | Buyer | Sale Price | Title Company |
|---|---|---|---|
| Stanley Edward M | -- | -- |
Source: Public Records
Tax History Compared to Growth
Tax History
| Year | Tax Paid | Tax Assessment Tax Assessment Total Assessment is a certain percentage of the fair market value that is determined by local assessors to be the total taxable value of land and additions on the property. | Land | Improvement |
|---|---|---|---|---|
| 2024 | $1,500 | $115,360 | $61,700 | $53,660 |
| 2023 | $1,288 | $102,220 | $52,700 | $49,520 |
| 2022 | $1,032 | $83,870 | $39,000 | $44,870 |
| 2021 | $914 | $83,870 | $39,000 | $44,870 |
| 2020 | $1,048 | $83,870 | $39,000 | $44,870 |
| 2019 | $1,099 | $63,914 | $35,952 | $27,962 |
| 2018 | $1,046 | $63,463 | $35,952 | $27,511 |
| 2017 | $1,118 | $63,914 | $35,952 | $27,962 |
| 2016 | $1,118 | $63,914 | $35,952 | $27,962 |
| 2015 | $1,171 | $64,364 | $35,952 | $28,412 |
| 2014 | $1,171 | $64,364 | $35,952 | $28,412 |
| 2013 | $1,173 | $64,814 | $35,952 | $28,862 |
Source: Public Records
Map
Nearby Homes
- 33 Corn Hill Rd
- 37 Corn Hill Rd
- 4-28 Old Town Rd Old County Rd Rd
- 366 Port Rd
- 21-5-3 E Palmer Rd
- 12 W Palmer Rd
- 85 E Side Rd
- 576 Port Rd
- 379 Cutler Rd
- 80 Holmes Way
- 76 Dunns Point Way
- MarkayEast Puffins Ln
- 1 Puffins Ln
- 321 Cutler Rd
- 285 & 291 Cutler Rd
- 191 Route 191 N
- 65 Lookout Mountain Rd
- 9 Tupper Ln
- 36 Cutler Rd
- 780 Cutler Rd