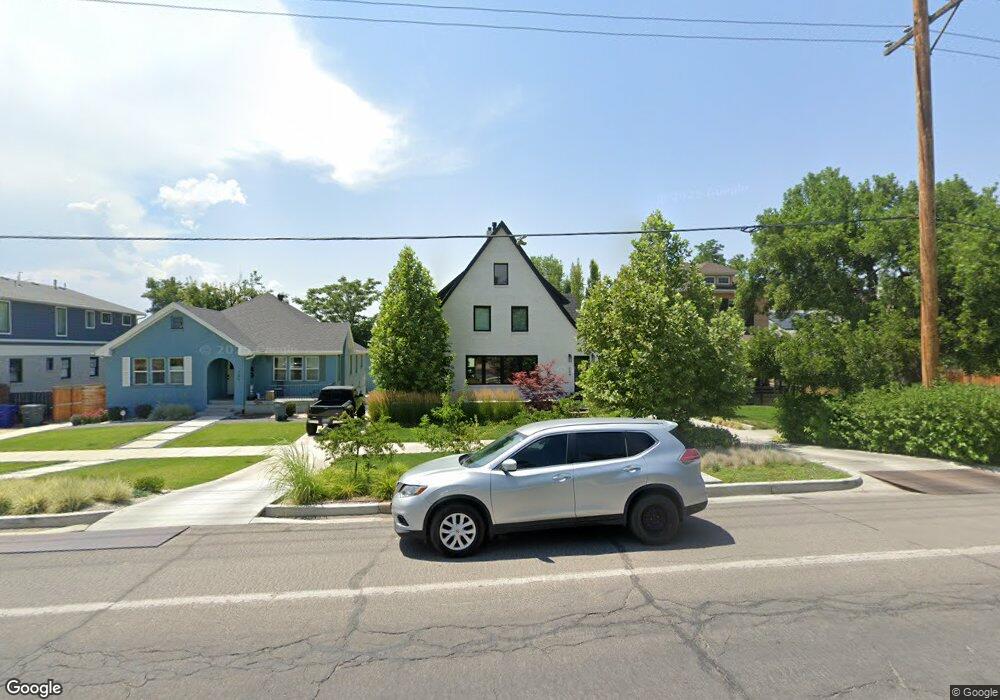
264 S 1100 E Salt Lake City, UT 84102
East Central NeighborhoodEstimated Value: $835,000 - $1,019,205
4
Beds
2
Baths
2,976
Sq Ft
$308/Sq Ft
Est. Value
About This Home
This home is located at 264 S 1100 E, Salt Lake City, UT 84102 and is currently estimated at $915,551, approximately $307 per square foot. 264 S 1100 E is a home located in Salt Lake County with nearby schools including Wasatch Elementary School, East High School, and Open Classroom.
Ownership History
Date
Name
Owned For
Owner Type
Purchase Details
Closed on
Jan 25, 2019
Sold by
Dean Lafleur Bonnie J and Dean Billheeimer D
Bought by
Bradley Matthew
Current Estimated Value
Purchase Details
Closed on
Jun 4, 2007
Sold by
Evans Helen P
Bought by
Lafleur Bonnie J and Dean Billheimer D
Home Financials for this Owner
Home Financials are based on the most recent Mortgage that was taken out on this home.
Original Mortgage
$372,000
Interest Rate
6.12%
Mortgage Type
Unknown
Create a Home Valuation Report for This Property
The Home Valuation Report is an in-depth analysis detailing your home's value as well as a comparison with similar homes in the area
Home Values in the Area
Average Home Value in this Area
Purchase History
| Date | Buyer | Sale Price | Title Company |
|---|---|---|---|
| Bradley Matthew | -- | Cottonwood Title | |
| Lafleur Bonnie J | -- | Landmark Title |
Source: Public Records
Mortgage History
| Date | Status | Borrower | Loan Amount |
|---|---|---|---|
| Previous Owner | Lafleur Bonnie J | $372,000 |
Source: Public Records
Tax History Compared to Growth
Tax History
| Year | Tax Paid | Tax Assessment Tax Assessment Total Assessment is a certain percentage of the fair market value that is determined by local assessors to be the total taxable value of land and additions on the property. | Land | Improvement |
|---|---|---|---|---|
| 2025 | $5,079 | $962,300 | $207,900 | $754,400 |
| 2024 | $5,079 | $969,100 | $196,700 | $772,400 |
| 2023 | $5,716 | $970,800 | $189,100 | $781,700 |
| 2022 | $5,716 | $986,300 | $185,400 | $800,900 |
| 2021 | $4,841 | $756,300 | $146,000 | $610,300 |
| 2020 | $3,317 | $493,300 | $142,000 | $351,300 |
| 2019 | $3,420 | $478,400 | $133,300 | $345,100 |
| 2018 | $3,338 | $454,800 | $133,300 | $321,500 |
| 2017 | $3,497 | $446,300 | $133,300 | $313,000 |
| 2016 | $3,329 | $403,500 | $93,100 | $310,400 |
| 2015 | $3,480 | $399,800 | $91,200 | $308,600 |
| 2014 | $3,358 | $382,700 | $89,400 | $293,300 |
Source: Public Records
Map
Nearby Homes
- 1058 E 200 S
- 243 S Elizabeth St
- 359 S 1100 E
- 365 S Elizabeth St
- 1116 E 400 S
- 1044 E 400 S Unit 407A
- 1227 E 300 S
- 115 S 1100 E Unit 614
- 101 S 1100 E Unit 101
- 1162 E 400 S
- 425 S 1000 E Unit 204C
- 1235 E 200 S Unit 1001
- 161 S 900 E
- 426 S 1000 E Unit 707
- 426 S 1000 E Unit 600
- 228 S 900 E
- 862 E Menlo Ave
- 447 S 1200 E
- 130 S 1300 E Unit 704
- 130 S 1300 E Unit 703
- 258 S 1100 E
- 266 S 1100 E
- 250 S 1100 E
- 1065 E 300 S
- 1066 E Markea Ave
- 1066 Markea Ave
- 278 S 1100 E
- 246 S 1100 E
- 1058 Markea Ave
- 1058 E Markea Ave
- 1063 E 300 S
- 1048 Markea Ave
- 1048 E Markea Ave Unit 2
- 1048 E Markea Ave
- 1053 E 300 S
- 238 S 1100 E
- 1068 Norris Place
- 1068 Norris Place Unit A
- 1068 E Norris Place
- 1064 Norris Place