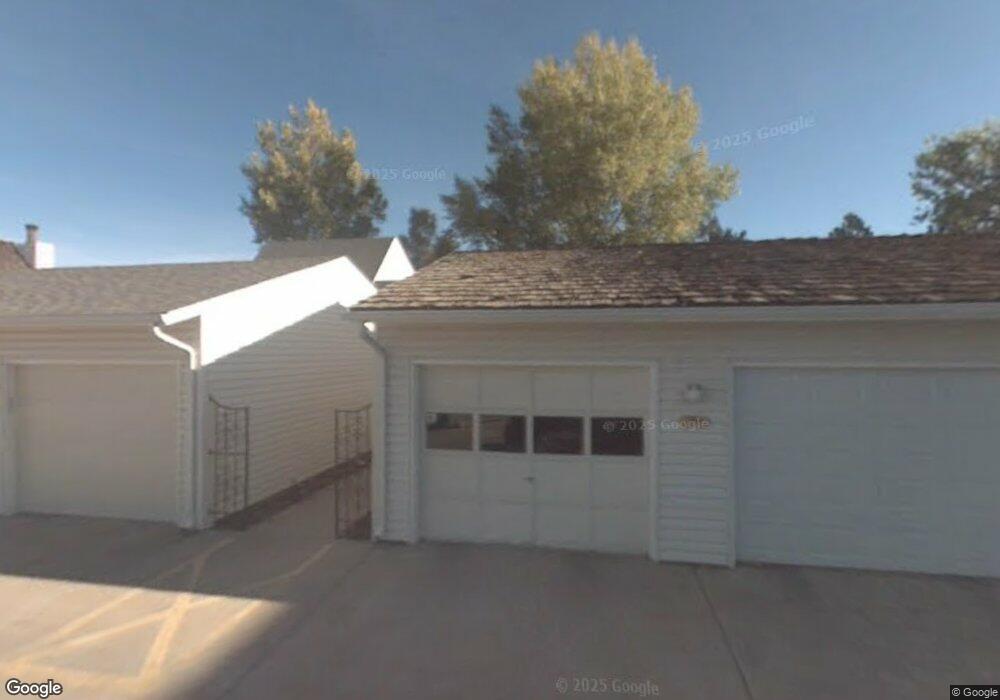
264 S 22nd Ave Brighton, CO 80601
Estimated Value: $325,000 - $354,000
3
Beds
3
Baths
1,792
Sq Ft
$191/Sq Ft
Est. Value
About This Home
This home is located at 264 S 22nd Ave, Brighton, CO 80601 and is currently estimated at $342,703, approximately $191 per square foot. 264 S 22nd Ave is a home located in Adams County with nearby schools including Southeast Elementary School, Vikan Middle School, and Brighton High School.
Ownership History
Date
Name
Owned For
Owner Type
Purchase Details
Closed on
May 28, 2010
Sold by
Lucile C Roberts Revocable Trust
Bought by
Smith Linda L
Current Estimated Value
Home Financials for this Owner
Home Financials are based on the most recent Mortgage that was taken out on this home.
Original Mortgage
$114,700
Outstanding Balance
$38,335
Interest Rate
5%
Mortgage Type
New Conventional
Estimated Equity
$304,368
Purchase Details
Closed on
Mar 11, 2004
Sold by
Roberts Lucille C
Bought by
Lucile C Roberts Revocable Trust
Purchase Details
Closed on
Jan 31, 2002
Sold by
Clark Hugh T and Clark Maria L
Bought by
Roberts Lucile C
Purchase Details
Closed on
Jan 5, 2001
Sold by
Adcock Orie C
Bought by
Clark Hugh T and Clark Maria L
Home Financials for this Owner
Home Financials are based on the most recent Mortgage that was taken out on this home.
Original Mortgage
$139,700
Interest Rate
7.78%
Mortgage Type
VA
Purchase Details
Closed on
May 28, 1997
Sold by
Lanning Norma J
Bought by
Adcock Orie C and Barnes Cynde M
Create a Home Valuation Report for This Property
The Home Valuation Report is an in-depth analysis detailing your home's value as well as a comparison with similar homes in the area
Home Values in the Area
Average Home Value in this Area
Purchase History
| Date | Buyer | Sale Price | Title Company |
|---|---|---|---|
| Smith Linda L | $135,000 | None Available | |
| Lucile C Roberts Revocable Trust | -- | -- | |
| Roberts Lucile C | $149,900 | -- | |
| Clark Hugh T | $137,000 | Land Title | |
| Adcock Orie C | $117,950 | -- |
Source: Public Records
Mortgage History
| Date | Status | Borrower | Loan Amount |
|---|---|---|---|
| Open | Smith Linda L | $114,700 | |
| Previous Owner | Clark Hugh T | $139,700 |
Source: Public Records
Tax History Compared to Growth
Tax History
| Year | Tax Paid | Tax Assessment Tax Assessment Total Assessment is a certain percentage of the fair market value that is determined by local assessors to be the total taxable value of land and additions on the property. | Land | Improvement |
|---|---|---|---|---|
| 2024 | $2,084 | $21,060 | $5,000 | $16,060 |
| 2023 | $2,072 | $22,390 | $4,600 | $17,790 |
| 2022 | $2,134 | $19,240 | $3,890 | $15,350 |
| 2021 | $2,008 | $19,240 | $3,890 | $15,350 |
| 2020 | $1,656 | $16,570 | $4,000 | $12,570 |
| 2019 | $1,659 | $16,570 | $4,000 | $12,570 |
| 2018 | $1,564 | $15,570 | $1,370 | $14,200 |
| 2017 | $1,566 | $15,570 | $1,370 | $14,200 |
| 2016 | $911 | $9,010 | $1,510 | $7,500 |
| 2015 | $905 | $9,010 | $1,510 | $7,500 |
| 2014 | -- | $8,430 | $1,510 | $6,920 |
Source: Public Records
Map
Nearby Homes
- 290 S 22nd Ave
- 316 S 22nd Ave
- 321 S 26th Ave
- 2587 E Egbert St
- 2618 E Egbert St
- 465 S 24th Ave
- 63 S 22nd Ave Unit A1-B8
- 551 Longhurst Place
- 2084 Donna Ct
- 595 Badger Creek Dr
- 2421 Wolf Creek Dr
- 3060 E Bridge St
- 3060 E Bridge St Unit 159
- 3060 E Bridge St Unit 213
- 3060 E Bridge St Unit 303
- 3060 E Bridge St Unit 277
- 1748 Emma Ln
- 406 S 16th Ave
- 2277 Wingler Place
- 434 Voiles Dr