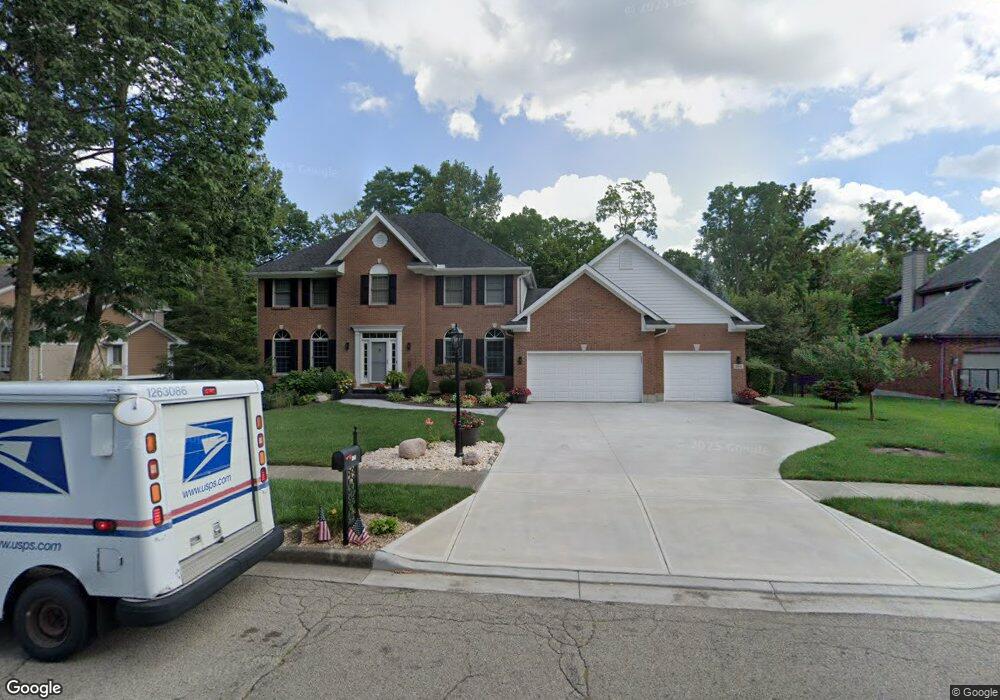
264 Timberleaf Dr Beavercreek, OH 45430
Estimated Value: $557,000 - $617,000
4
Beds
4
Baths
3,306
Sq Ft
$180/Sq Ft
Est. Value
About This Home
This home is located at 264 Timberleaf Dr, Beavercreek, OH 45430 and is currently estimated at $596,551, approximately $180 per square foot. 264 Timberleaf Dr is a home located in Greene County with nearby schools including Fairbrook Elementary School, Herman K Ankeney Middle School, and Beavercreek High School.
Ownership History
Date
Name
Owned For
Owner Type
Purchase Details
Closed on
Dec 17, 2024
Sold by
Phillips Lawrence E and Phillips Sheila M
Bought by
Ls Phillips Family Trust and Phillips
Current Estimated Value
Purchase Details
Closed on
May 3, 2021
Sold by
Robie Kevin A and Robie Nancy A
Bought by
Phillips Lawrence E and Sheila M Phillips Revocable Li
Purchase Details
Closed on
Sep 17, 2017
Sold by
Robie Kevin A and Robie Nancy A
Bought by
Robie Kevin A and Nancy A Robie
Purchase Details
Closed on
Oct 21, 1996
Sold by
Martin Burger Homes Inc
Bought by
Robie Kevin A and Robie A
Home Financials for this Owner
Home Financials are based on the most recent Mortgage that was taken out on this home.
Original Mortgage
$160,000
Interest Rate
8.44%
Mortgage Type
New Conventional
Purchase Details
Closed on
Nov 24, 1995
Sold by
Clemens Richard M
Bought by
Burger Custom Homes Inc
Create a Home Valuation Report for This Property
The Home Valuation Report is an in-depth analysis detailing your home's value as well as a comparison with similar homes in the area
Home Values in the Area
Average Home Value in this Area
Purchase History
| Date | Buyer | Sale Price | Title Company |
|---|---|---|---|
| Ls Phillips Family Trust | -- | None Listed On Document | |
| Phillips Lawrence E | -- | None Listed On Document | |
| Phillips Lawrence E | $470,000 | None Available | |
| Robie Kevin A | -- | -- | |
| Robie Kevin A | $312,500 | -- | |
| Burger Custom Homes Inc | $48,000 | -- |
Source: Public Records
Mortgage History
| Date | Status | Borrower | Loan Amount |
|---|---|---|---|
| Previous Owner | Robie Kevin A | $160,000 |
Source: Public Records
Tax History
| Year | Tax Paid | Tax Assessment Tax Assessment Total Assessment is a certain percentage of the fair market value that is determined by local assessors to be the total taxable value of land and additions on the property. | Land | Improvement |
|---|---|---|---|---|
| 2024 | $10,907 | $165,380 | $32,010 | $133,370 |
| 2023 | $10,802 | $165,380 | $32,010 | $133,370 |
| 2022 | $10,277 | $138,880 | $24,630 | $114,250 |
| 2021 | $10,068 | $138,880 | $24,630 | $114,250 |
| 2020 | $10,144 | $138,880 | $24,630 | $114,250 |
| 2019 | $11,227 | $140,290 | $22,820 | $117,470 |
| 2018 | $9,909 | $140,290 | $22,820 | $117,470 |
| 2017 | $9,166 | $140,290 | $22,820 | $117,470 |
| 2016 | $9,167 | $125,710 | $22,820 | $102,890 |
| 2015 | $9,113 | $125,710 | $22,820 | $102,890 |
| 2014 | $8,585 | $120,360 | $22,820 | $97,540 |
Source: Public Records
Map
Nearby Homes
- 3785 Frostwood Dr
- 438 Grange Hall Rd
- 3597 Echo Hill Ln
- 3978 Indian Ripple Rd
- 615 Bendwood Way
- 3867 Lofty Oaks Dr
- 185 Bramblebush Trail
- 197 Bramblebush Trail
- 205 Elmwood Place
- 635 Breckenridge Way
- 3985 Shagbark Ln
- 208 Glenview Dr
- 25 Martingham Ct Unit 25
- 3414 Shakertown Rd
- 2658 Tompkins Place
- 3392 Greenburn Rd Unit 3392
- 2759 Shelburne Ln
- 3691 Southbrook Dr
- 713 Newton Dr
- 457 Merrick Dr
- 256 Timberleaf Dr
- 270 Timberleaf Dr
- 269 Timberleaf Dr
- 255 Timberleaf Dr
- 278 Timberleaf Dr
- 273 Timberleaf Dr
- 263 Timberleaf Dr
- 3837 Eagle Point Dr
- 284 Timberleaf Dr
- 279 Timberleaf Dr
- 245 Grange Hall Rd
- 234 Grange Hall Rd
- 287 Timberleaf Dr
- 3847 Eagle Point Dr
- 290 Timberleaf Dr
- 224 Grange Hall Rd
- 308 Grange Hall Rd
- 194 Grange Hall Rd
- 3846 Eagle Point Dr
- 268 Aspen Brook Dr
Your Personal Tour Guide
Ask me questions while you tour the home.