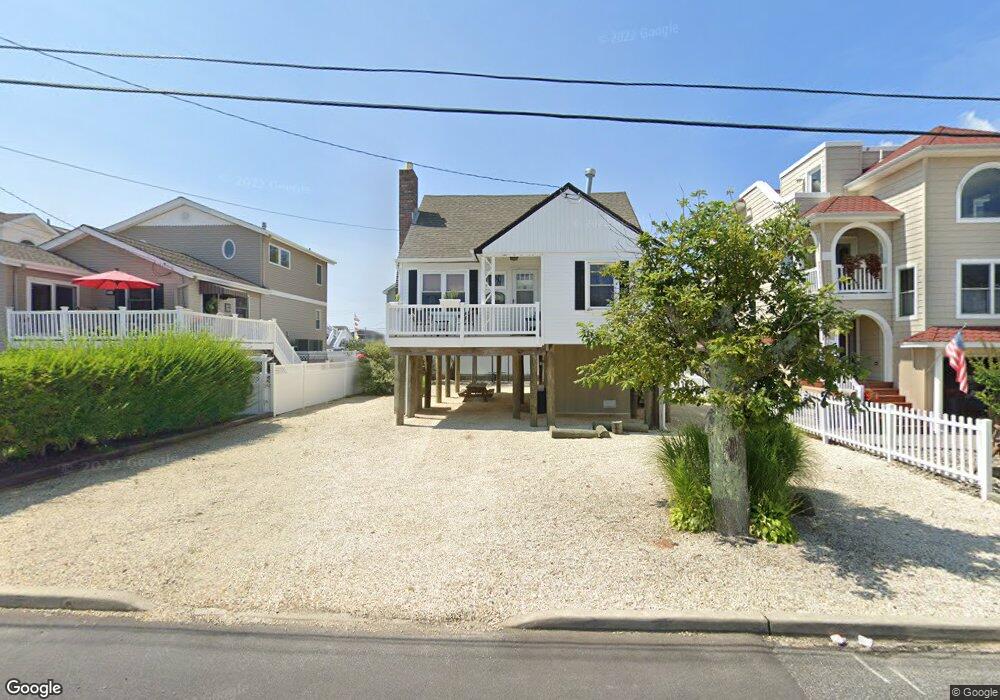
264 W 18th St Ship Bottom, NJ 08008
Long Beach Island NeighborhoodEstimated Value: $751,000 - $1,171,000
3
Beds
2
Baths
1,069
Sq Ft
$917/Sq Ft
Est. Value
About This Home
This home is located at 264 W 18th St, Ship Bottom, NJ 08008 and is currently estimated at $979,836, approximately $916 per square foot. 264 W 18th St is a home with nearby schools including Ethel A. Jacobsen Elementary School, Long Beach Island Grade School, and Southern Regional Middle School.
Ownership History
Date
Name
Owned For
Owner Type
Purchase Details
Closed on
Mar 21, 1995
Sold by
Horton Howard J
Bought by
Mccabe Patrick C and Holter Catherine
Current Estimated Value
Home Financials for this Owner
Home Financials are based on the most recent Mortgage that was taken out on this home.
Original Mortgage
$158,000
Interest Rate
8.89%
Create a Home Valuation Report for This Property
The Home Valuation Report is an in-depth analysis detailing your home's value as well as a comparison with similar homes in the area
Home Values in the Area
Average Home Value in this Area
Purchase History
| Date | Buyer | Sale Price | Title Company |
|---|---|---|---|
| Mccabe Patrick C | $175,000 | -- |
Source: Public Records
Mortgage History
| Date | Status | Borrower | Loan Amount |
|---|---|---|---|
| Closed | Mccabe Patrick C | $158,000 |
Source: Public Records
Tax History Compared to Growth
Tax History
| Year | Tax Paid | Tax Assessment Tax Assessment Total Assessment is a certain percentage of the fair market value that is determined by local assessors to be the total taxable value of land and additions on the property. | Land | Improvement |
|---|---|---|---|---|
| 2025 | $5,704 | $473,400 | $342,500 | $130,900 |
| 2024 | $5,439 | $473,400 | $342,500 | $130,900 |
| 2023 | $5,013 | $473,400 | $342,500 | $130,900 |
| 2022 | $5,013 | $473,400 | $342,500 | $130,900 |
| 2021 | $4,990 | $473,400 | $342,500 | $130,900 |
| 2020 | $5,004 | $473,400 | $342,500 | $130,900 |
| 2019 | $5,009 | $473,400 | $342,500 | $130,900 |
| 2018 | $5,018 | $473,400 | $342,500 | $130,900 |
| 2017 | $4,691 | $473,400 | $342,500 | $130,900 |
| 2016 | $3,776 | $341,100 | $281,300 | $59,800 |
| 2015 | $3,684 | $341,100 | $281,300 | $59,800 |
| 2014 | $3,680 | $341,100 | $281,300 | $59,800 |
Source: Public Records
Map
Nearby Homes
- 1810 Central Ave Unit 15
- 1810 Central Ave Unit 17
- 111 W 18th St Unit 2
- 1903 Pennsylvania Ave
- 2109 Central Ave
- 1306 Barnegat Ave
- 1219 Long Beach Blvd
- 108 W 10th St
- 1001 Ocean Ave Unit 1017
- 1001 Ocean Ave Unit 1012
- 615 Barnegat Ave
- 2 Northeast Dr
- 2572 E East Bay Ave
- 401 Boulevard Unit 306
- 401 Boulevard Unit 506
- 401 Boulevard Unit 508
- 401 Boulevard Unit 503
- 401 Boulevard Unit 201
- 401 Boulevard Unit 205
- 401 Boulevard Unit 202