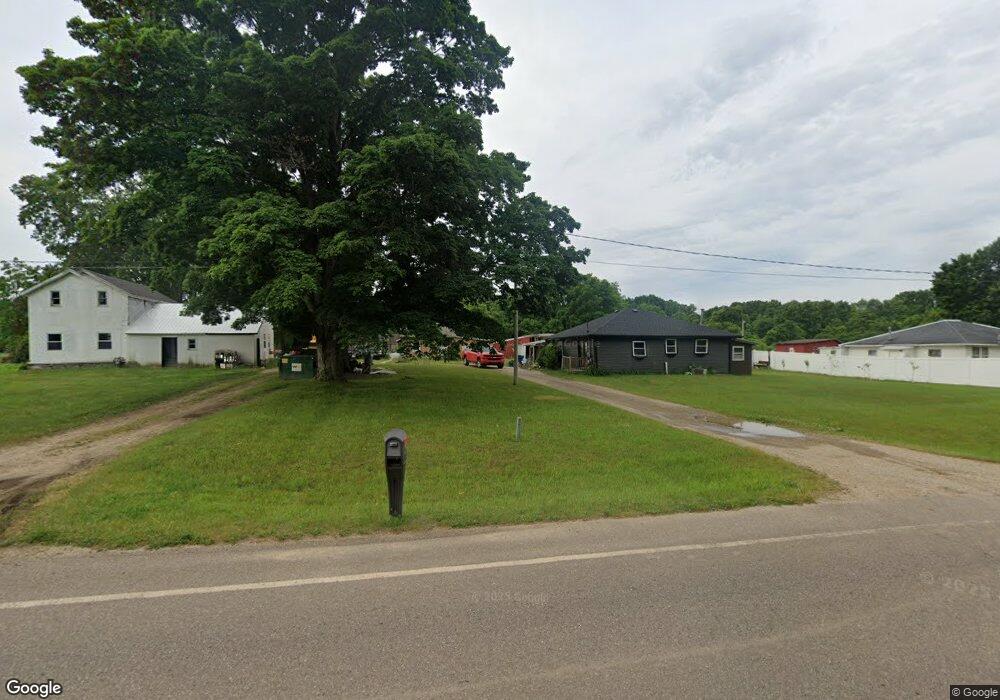
2640 113th Ave Allegan, MI 49010
Estimated Value: $580,707 - $1,045,000
11
Beds
5
Baths
5,810
Sq Ft
$134/Sq Ft
Est. Value
About This Home
This home is located at 2640 113th Ave, Allegan, MI 49010 and is currently estimated at $781,236, approximately $134 per square foot. 2640 113th Ave is a home located in Allegan County with nearby schools including Pine Trails Elementary School, L.E. White Middle School, and Allegan High School.
Ownership History
Date
Name
Owned For
Owner Type
Purchase Details
Closed on
Apr 28, 2003
Sold by
L S R D Ltd
Bought by
Gilliam Daniel A
Current Estimated Value
Home Financials for this Owner
Home Financials are based on the most recent Mortgage that was taken out on this home.
Original Mortgage
$75,500
Outstanding Balance
$33,827
Interest Rate
5.86%
Mortgage Type
Unknown
Estimated Equity
$689,182
Create a Home Valuation Report for This Property
The Home Valuation Report is an in-depth analysis detailing your home's value as well as a comparison with similar homes in the area
Home Values in the Area
Average Home Value in this Area
Purchase History
| Date | Buyer | Sale Price | Title Company |
|---|---|---|---|
| Gilliam Daniel A | $14,600 | Chicago Title |
Source: Public Records
Mortgage History
| Date | Status | Borrower | Loan Amount |
|---|---|---|---|
| Open | Gilliam Daniel A | $75,500 |
Source: Public Records
Tax History Compared to Growth
Tax History
| Year | Tax Paid | Tax Assessment Tax Assessment Total Assessment is a certain percentage of the fair market value that is determined by local assessors to be the total taxable value of land and additions on the property. | Land | Improvement |
|---|---|---|---|---|
| 2025 | $4,200 | $315,900 | $107,400 | $208,500 |
| 2024 | $3,829 | $258,200 | $74,600 | $183,600 |
| 2023 | $3,829 | $224,100 | $63,700 | $160,400 |
| 2022 | $3,829 | $199,900 | $62,700 | $137,200 |
| 2021 | $3,814 | $191,200 | $63,700 | $127,500 |
| 2020 | $3,814 | $186,500 | $61,600 | $124,900 |
| 2019 | $0 | $168,800 | $56,000 | $112,800 |
| 2018 | $0 | $153,300 | $59,000 | $94,300 |
| 2017 | $0 | $147,000 | $57,800 | $89,200 |
| 2016 | $0 | $135,700 | $48,400 | $87,300 |
| 2015 | -- | $138,500 | $0 | $0 |
| 2014 | -- | $124,000 | $46,600 | $77,400 |
| 2013 | -- | $136,800 | $47,100 | $89,700 |
Source: Public Records
Map
Nearby Homes