2640 Burridge Cir Twinsburg, OH 44087
Estimated Value: $263,000 - $310,939
3
Beds
3
Baths
1,512
Sq Ft
$193/Sq Ft
Est. Value
About This Home
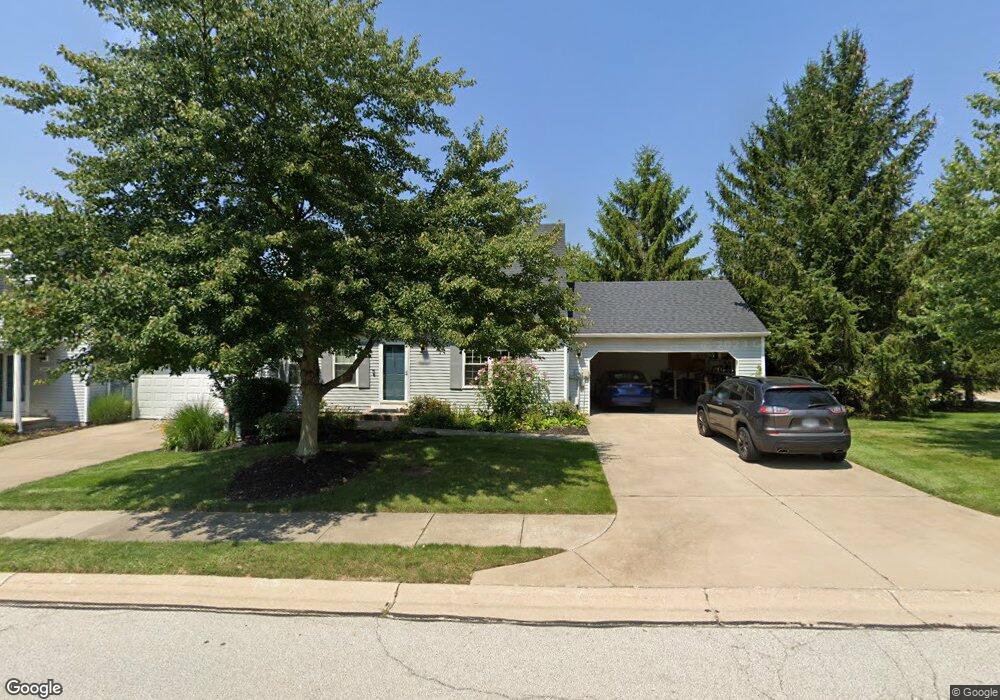
This home is located at 2640 Burridge Cir, Twinsburg, OH 44087 and is currently estimated at $291,985, approximately $193 per square foot. 2640 Burridge Cir is a home located in Summit County with nearby schools including Wilcox Primary School, Dodge Intermediate School, and Samuel Bissell Elementary School.
Ownership History
Date
Name
Owned For
Owner Type
Purchase Details
Closed on
Apr 4, 2023
Sold by
Mcquerry Trinity G
Bought by
Kleinman Iris and Shanes Zachary D
Current Estimated Value
Home Financials for this Owner
Home Financials are based on the most recent Mortgage that was taken out on this home.
Original Mortgage
$254,140
Outstanding Balance
$246,947
Interest Rate
6.5%
Mortgage Type
New Conventional
Estimated Equity
$45,038
Purchase Details
Closed on
Apr 13, 2017
Sold by
Nye Paul Michael
Bought by
Mullen Susan M and Susan M Mullen Trust
Purchase Details
Closed on
May 11, 2016
Sold by
Wagner James L
Bought by
Kantura Sharon
Home Financials for this Owner
Home Financials are based on the most recent Mortgage that was taken out on this home.
Original Mortgage
$120,000
Interest Rate
3.59%
Mortgage Type
New Conventional
Purchase Details
Closed on
Sep 23, 2000
Sold by
Harris Edward L and Harris Marcia K
Bought by
Horvath Marilyn
Create a Home Valuation Report for This Property
The Home Valuation Report is an in-depth analysis detailing your home's value as well as a comparison with similar homes in the area
Home Values in the Area
Average Home Value in this Area
Purchase History
| Date | Buyer | Sale Price | Title Company |
|---|---|---|---|
| Kleinman Iris | $262,000 | Infinity Title | |
| Mullen Susan M | $82,500 | None Available | |
| Kantura Sharon | $170,000 | None Available | |
| Horvath Marilyn | $190,000 | -- |
Source: Public Records
Mortgage History
| Date | Status | Borrower | Loan Amount |
|---|---|---|---|
| Open | Kleinman Iris | $254,140 | |
| Previous Owner | Kantura Sharon | $120,000 |
Source: Public Records
Tax History Compared to Growth
Tax History
| Year | Tax Paid | Tax Assessment Tax Assessment Total Assessment is a certain percentage of the fair market value that is determined by local assessors to be the total taxable value of land and additions on the property. | Land | Improvement |
|---|---|---|---|---|
| 2025 | $3,912 | $84,519 | $8,334 | $76,185 |
| 2024 | $3,912 | $84,466 | $8,281 | $76,185 |
| 2023 | $3,912 | $81,295 | $8,281 | $73,014 |
| 2022 | $3,138 | $58,156 | $5,915 | $52,241 |
| 2021 | $3,153 | $58,156 | $5,915 | $52,241 |
| 2020 | $3,058 | $58,160 | $5,920 | $52,240 |
| 2019 | $2,935 | $52,170 | $5,800 | $46,370 |
| 2018 | $2,876 | $52,170 | $5,800 | $46,370 |
| 2017 | $2,713 | $52,170 | $5,800 | $46,370 |
| 2016 | $2,697 | $52,170 | $5,800 | $46,370 |
| 2015 | $2,713 | $52,170 | $5,800 | $46,370 |
| 2014 | $2,708 | $52,170 | $5,800 | $46,370 |
| 2013 | $3,041 | $58,640 | $5,800 | $52,840 |
Source: Public Records
Map
Nearby Homes
- 2607 Burridge Cir Unit M29
- 10000 Ravenna Rd
- 2619 E Aurora Rd
- 2869 Tinkers Ln
- 2708 Edgebrook Crossing Unit 19
- V/L- Eton St
- 10413 Fox Hollow Cir
- 2055 Rugby St
- 2064 Case St
- 1959 Rugby St
- 2825 Veron Ln
- 1897 Case St
- 2051 Presidential Pkwy
- 2015 Presidential Pkwy Unit G60
- 2590 Post Rd
- 3284 Cannon Rd
- 9101 Chamberlin Rd
- 3281 Evans Way
- 9639 E Idlewood Dr Unit E16
- 9452 Fairfield Dr
- 2640 Burridge Cir Unit 3A
- 2642 Burridge Cir
- 2638 Burridge Cir Unit B4
- 2644 Burridge Cir
- 2636 Burridge Cir Unit B5
- 2636 Burridge Cir Unit 5b
- 2641 Burridge Cir
- 2631 Burridge Cir
- 2639 Burridge Cir
- 2633 Burridge Cir
- 2643 Burridge Cir Unit U44
- 2634 Burridge Cir
- 2629 Burridge Cir
- 2632 Burridge Cir Unit C7
- 2630 Burridge Cir
- 2637 Burridge Cir Unit 41T
- 2637 Burridge Cir
- 2635 Burridge Cir Unit T40
- 2635 Burridge Cir Unit 40T
- 2628 Burridge Cir