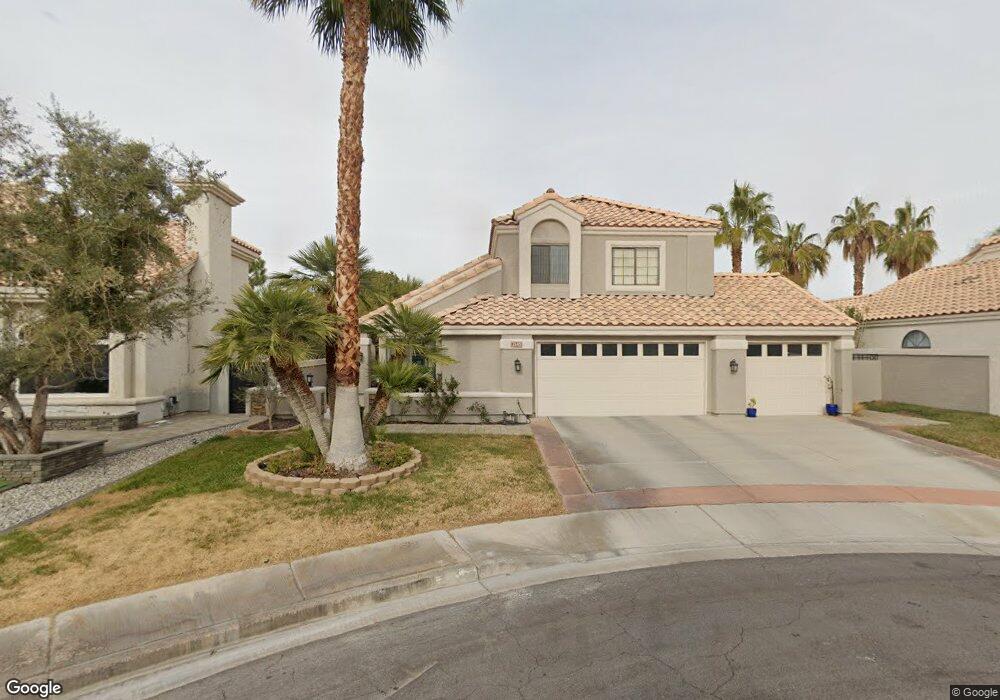
2640 Douglas Cir Unit 4A Henderson, NV 89074
Green Valley North NeighborhoodEstimated Value: $593,999 - $632,000
3
Beds
3
Baths
2,363
Sq Ft
$259/Sq Ft
Est. Value
About This Home
This home is located at 2640 Douglas Cir Unit 4A, Henderson, NV 89074 and is currently estimated at $612,750, approximately $259 per square foot. 2640 Douglas Cir Unit 4A is a home located in Clark County with nearby schools including David M Cox Elementary School, Barbara and Hank Greenspun Junior High School, and Silverado High School.
Ownership History
Date
Name
Owned For
Owner Type
Purchase Details
Closed on
Dec 2, 2021
Sold by
Shapiro Scott
Bought by
Shapiro Scott and The November Trust
Current Estimated Value
Home Financials for this Owner
Home Financials are based on the most recent Mortgage that was taken out on this home.
Original Mortgage
$330,000
Outstanding Balance
$303,635
Interest Rate
3.14%
Mortgage Type
New Conventional
Estimated Equity
$309,115
Purchase Details
Closed on
Jun 7, 2001
Sold by
Kleven David and Kleven Cherina
Bought by
Shapiro Scott
Home Financials for this Owner
Home Financials are based on the most recent Mortgage that was taken out on this home.
Original Mortgage
$218,500
Interest Rate
7.14%
Purchase Details
Closed on
Oct 8, 1996
Sold by
Kleven David
Bought by
Kleven Cherina
Create a Home Valuation Report for This Property
The Home Valuation Report is an in-depth analysis detailing your home's value as well as a comparison with similar homes in the area
Home Values in the Area
Average Home Value in this Area
Purchase History
| Date | Buyer | Sale Price | Title Company |
|---|---|---|---|
| Shapiro Scott | -- | Western Title Company La | |
| Shapiro Scott | $230,000 | Lawyers Title | |
| Kleven Cherina | -- | Nevada Title Company |
Source: Public Records
Mortgage History
| Date | Status | Borrower | Loan Amount |
|---|---|---|---|
| Open | Shapiro Scott | $330,000 | |
| Previous Owner | Shapiro Scott | $218,500 |
Source: Public Records
Tax History Compared to Growth
Tax History
| Year | Tax Paid | Tax Assessment Tax Assessment Total Assessment is a certain percentage of the fair market value that is determined by local assessors to be the total taxable value of land and additions on the property. | Land | Improvement |
|---|---|---|---|---|
| 2025 | $2,424 | $135,186 | $57,050 | $78,136 |
| 2024 | $2,354 | $135,186 | $57,050 | $78,136 |
| 2023 | $2,354 | $121,988 | $47,250 | $74,738 |
| 2022 | $2,285 | $106,508 | $37,450 | $69,058 |
| 2021 | $2,219 | $103,354 | $37,450 | $65,904 |
| 2020 | $2,151 | $103,216 | $37,450 | $65,766 |
| 2019 | $2,089 | $98,495 | $33,250 | $65,245 |
| 2018 | $2,028 | $90,311 | $27,300 | $63,011 |
| 2017 | $2,657 | $91,672 | $27,300 | $64,372 |
| 2016 | $1,921 | $83,872 | $19,250 | $64,622 |
| 2015 | $1,916 | $75,938 | $16,800 | $59,138 |
| 2014 | $1,860 | $62,310 | $12,250 | $50,060 |
Source: Public Records
Map
Nearby Homes
- 2657 Storey Cir
- 314 Lander Dr
- 367 Lander Dr
- 7483 Forestdale Ct
- 353 Lander Terrace
- 2670 Ridgewater Cir
- 2766 Red Vista Ct
- 2763 Red Vista Ct
- 353 Clayton St
- 2775 Red Vista Ct
- 2786 Fountain Ridge Ln
- 2792 Fountain Ridge Ln
- 2722 Briarcliff Ave
- 3120 E Eldorado Ln
- 2709 Briarcliff Ave
- 2520 Machado Dr
- 319 Carrington St
- 2926 E Eldorado Ln
- 3221 Montecito Dr
- 2250 Bowie Cir
- 2642 Douglas Cir
- 368 Clark Dr
- 2644 Douglas Cir
- 360 Clark Dr
- 2610 White Pine Dr Unit 2
- 2612 White Pine Dr
- 2612 White Pine Dr
- 2612 White Pine Dr
- 2639 Douglas Cir
- 2608 White Pine Dr
- 2643 Douglas Cir
- 2641 Douglas Cir
- 352 Clark Dr
- 368 Clark Dr
- 348 Clark Dr
- 344 Clark Dr
- 2647 Douglas Cir Unit 5
- 2604 Elko Cir
- 2616 White Pine Dr
- 2616 White Pine Dr Unit 1