Estimated Value: $447,000 - $510,000
--
Bed
--
Bath
1,404
Sq Ft
$341/Sq Ft
Est. Value
About This Home
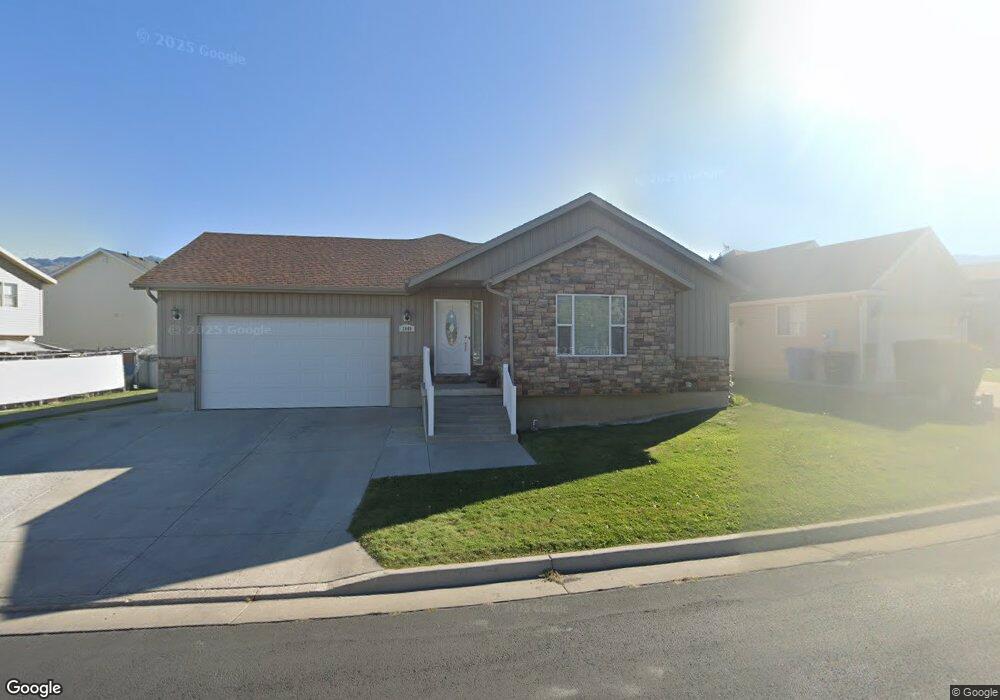
This home is located at 2640 Meadow Ln Unit 89, Logan, UT 84341 and is currently estimated at $478,576, approximately $340 per square foot. 2640 Meadow Ln Unit 89 is a home located in Cache County with nearby schools including Greenville School, Cedar Ridge School, and Cedar Ridge Middle School.
Ownership History
Date
Name
Owned For
Owner Type
Purchase Details
Closed on
Aug 16, 2017
Sold by
Tang Yongjun Tony
Bought by
Brown David J and Brown Judy L
Current Estimated Value
Purchase Details
Closed on
Apr 30, 2008
Sold by
Rigby Roger C and Rigby Kristina Fawn
Bought by
Tang Yongjun Tony
Home Financials for this Owner
Home Financials are based on the most recent Mortgage that was taken out on this home.
Original Mortgage
$195,200
Interest Rate
5.81%
Mortgage Type
New Conventional
Purchase Details
Closed on
Dec 22, 2006
Sold by
B & N Creative Homes Llc
Bought by
Rigby Roger C and Rigby Kristina Fawn
Home Financials for this Owner
Home Financials are based on the most recent Mortgage that was taken out on this home.
Original Mortgage
$20,000
Interest Rate
6.16%
Mortgage Type
Stand Alone Second
Create a Home Valuation Report for This Property
The Home Valuation Report is an in-depth analysis detailing your home's value as well as a comparison with similar homes in the area
Home Values in the Area
Average Home Value in this Area
Purchase History
| Date | Buyer | Sale Price | Title Company |
|---|---|---|---|
| Brown David J | -- | None Available | |
| Tang Yongjun Tony | -- | Advanced Title | |
| Rigby Roger C | -- | Heritage West Title | |
| B & N Creative Homes Llc | -- | Heritage West Title |
Source: Public Records
Mortgage History
| Date | Status | Borrower | Loan Amount |
|---|---|---|---|
| Previous Owner | Tang Yongjun Tony | $195,200 | |
| Previous Owner | Rigby Roger C | $20,000 | |
| Previous Owner | B & N Creative Homes Llc | $20,000 | |
| Previous Owner | Rigby Roger C | $159,712 |
Source: Public Records
Tax History Compared to Growth
Tax History
| Year | Tax Paid | Tax Assessment Tax Assessment Total Assessment is a certain percentage of the fair market value that is determined by local assessors to be the total taxable value of land and additions on the property. | Land | Improvement |
|---|---|---|---|---|
| 2025 | $1,949 | $272,825 | $0 | $0 |
| 2024 | $2,212 | $288,100 | $0 | $0 |
| 2023 | $2,366 | $284,925 | $0 | $0 |
| 2022 | $2,476 | $284,930 | $0 | $0 |
| 2021 | $2,028 | $361,611 | $59,350 | $302,261 |
| 2020 | $1,929 | $322,186 | $59,350 | $262,836 |
| 2019 | $2,019 | $322,186 | $59,350 | $262,836 |
| 2018 | $1,807 | $279,125 | $44,450 | $234,675 |
| 2017 | $1,813 | $147,375 | $0 | $0 |
| 2016 | $1,842 | $108,575 | $0 | $0 |
| 2015 | $1,363 | $108,575 | $0 | $0 |
| 2014 | $1,332 | $108,575 | $0 | $0 |
| 2013 | -- | $106,105 | $0 | $0 |
Source: Public Records
Map
Nearby Homes
- 2640 N Aspen Park Ln
- 2592 N 330 E
- 2700 N 300 E
- 667 E 2475 N Unit 8
- 623 E 2475 N Unit 5
- 645 E 2475 N Unit 6
- 651 E 2475 N Unit 7
- 721 E 2475 N Unit 12
- 679 E 2475 N Unit 9
- 685 E 2475 N
- 645 E 2475 N
- 709 E 2475 N Unit 11
- 667 E 2475 N
- 2469 N 620 E Unit 3
- 2477 N 620 E Unit 4
- 684 E 2475 N
- 710 E 2475 N
- 650 E 2450 N
- 2377 N 740 E
- 2377 N 740 E Unit 32
- 2640 Meadow Ln
- 2634 Meadow Ln
- 516 Red Oak Dr
- 520 Red Oak Dr
- 2641 Meadow Ln
- 2637 Meadow Ln
- 2630 Meadow Ln
- 2605 Meadow Ln Unit 75
- 2645 Meadow Ln
- 530 Red Oak Dr Unit 50
- 530 Red Oak Dr
- 2633 Meadow Ln
- 530 E Red Oak Dr
- 2627 Meadow Ln
- 2624 Meadow Ln
- 470 Red Oak Dr Unit 59
- 470 Red Oak Dr
- 540 Red Oak Dr Unit 47
- 540 Red Oak Dr
- 503 E Red Oak Dr