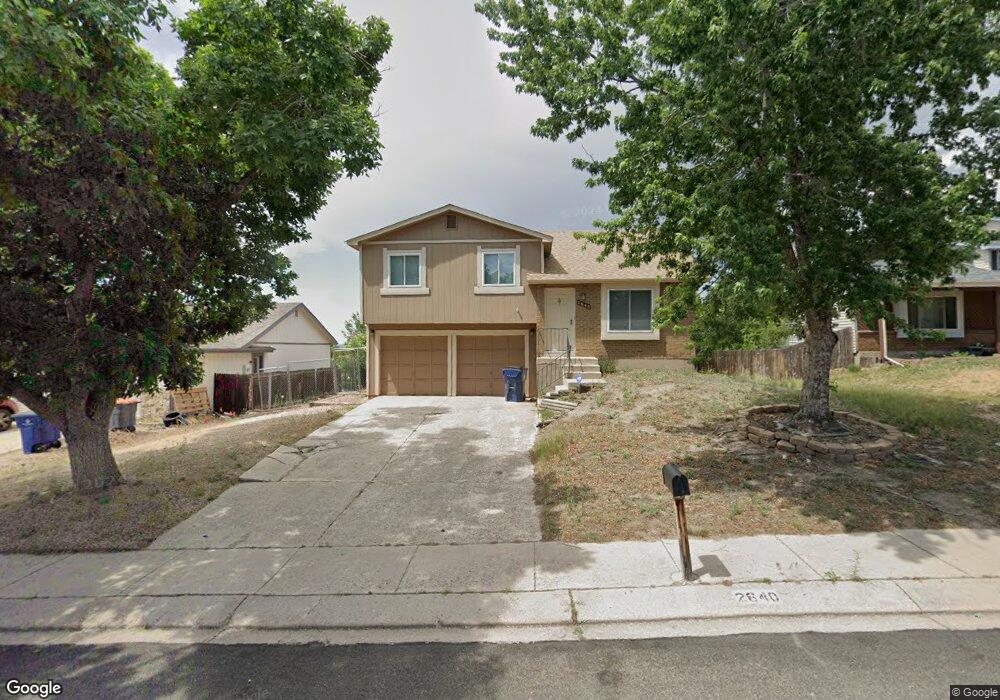
2640 Purgatory Dr Colorado Springs, CO 80918
Pulpit Rock NeighborhoodEstimated Value: $407,879 - $452,000
3
Beds
2
Baths
1,464
Sq Ft
$293/Sq Ft
Est. Value
About This Home
This home is located at 2640 Purgatory Dr, Colorado Springs, CO 80918 and is currently estimated at $429,470, approximately $293 per square foot. 2640 Purgatory Dr is a home located in El Paso County with nearby schools including King Elementary School, Russell Middle School, and Coronado High School.
Ownership History
Date
Name
Owned For
Owner Type
Purchase Details
Closed on
Oct 7, 2011
Sold by
Hornback Victor W and Hornback Cara Lea A
Bought by
Jackson Kurtney W
Current Estimated Value
Home Financials for this Owner
Home Financials are based on the most recent Mortgage that was taken out on this home.
Original Mortgage
$164,000
Outstanding Balance
$112,821
Interest Rate
4.28%
Mortgage Type
VA
Estimated Equity
$316,649
Purchase Details
Closed on
Oct 31, 1997
Sold by
Bagnell Kelly G and Bagnell Tara K
Bought by
Hornback Victor W and Hornback Cara Lea A
Home Financials for this Owner
Home Financials are based on the most recent Mortgage that was taken out on this home.
Original Mortgage
$120,553
Interest Rate
7.27%
Mortgage Type
FHA
Purchase Details
Closed on
Oct 30, 1990
Bought by
Jackson Kurtney W
Purchase Details
Closed on
Aug 6, 1987
Bought by
Jackson Kurtney W
Purchase Details
Closed on
Nov 1, 1980
Bought by
Jackson Kurtney W
Create a Home Valuation Report for This Property
The Home Valuation Report is an in-depth analysis detailing your home's value as well as a comparison with similar homes in the area
Home Values in the Area
Average Home Value in this Area
Purchase History
| Date | Buyer | Sale Price | Title Company |
|---|---|---|---|
| Jackson Kurtney W | $164,000 | Cb Title | |
| Hornback Victor W | $121,500 | Security Title | |
| Jackson Kurtney W | $72,900 | -- | |
| Jackson Kurtney W | -- | -- | |
| Jackson Kurtney W | -- | -- |
Source: Public Records
Mortgage History
| Date | Status | Borrower | Loan Amount |
|---|---|---|---|
| Open | Jackson Kurtney W | $164,000 | |
| Previous Owner | Hornback Victor W | $120,553 |
Source: Public Records
Tax History Compared to Growth
Tax History
| Year | Tax Paid | Tax Assessment Tax Assessment Total Assessment is a certain percentage of the fair market value that is determined by local assessors to be the total taxable value of land and additions on the property. | Land | Improvement |
|---|---|---|---|---|
| 2025 | $1,338 | $28,570 | -- | -- |
| 2024 | $858 | $28,480 | $4,840 | $23,640 |
| 2022 | $594 | $17,560 | $4,300 | $13,260 |
| 2021 | $644 | $18,070 | $4,430 | $13,640 |
| 2020 | $452 | $13,320 | $3,850 | $9,470 |
| 2019 | $899 | $13,320 | $3,850 | $9,470 |
| 2018 | $828 | $11,280 | $3,240 | $8,040 |
| 2017 | $784 | $11,280 | $3,240 | $8,040 |
| 2016 | $620 | $10,690 | $3,340 | $7,350 |
| 2015 | $617 | $10,690 | $3,340 | $7,350 |
| 2014 | $585 | $9,720 | $3,300 | $6,420 |
Source: Public Records
Map
Nearby Homes
- 6533 Charter Dr
- 6423 McNichols Ct
- 2750 Purgatory Dr
- 6447 Jonathan Ct Unit E1
- 2635 Canton Ln
- 6655 Sproul Ln
- 2840 Purgatory Dr
- 2860 Purgatory Dr
- 2570 Covington Place
- 2810 Downhill Dr
- 6215 Lange Dr
- 2815 Downhill Dr
- 2563 Integrity Ct
- 6641 Gambol Quail Dr W
- 2982 Buttermilk Cir
- 2940 Purgatory Dr
- 2970 Banjo Dr
- 2910 Downhill Dr
- 3045 Dublin Blvd
- 2842 Deliverance Dr
- 2630 Purgatory Dr
- 2650 Purgatory Dr
- 2660 Purgatory Dr
- 2620 Purgatory Dr
- 2645 Purgatory Dr
- 2655 Purgatory Dr
- 2635 Purgatory Dr
- 2670 Purgatory Dr
- 2665 Purgatory Dr
- 2625 Purgatory Dr
- 2640 Tuckerman Ct
- 2675 Purgatory Dr
- 2680 Purgatory Dr
- 6455 McNichols Ct Unit L6
- 2650 Tuckerman Ct
- 2630 Tuckerman Ct
- 6453 McNichols Ct
- 2620 Tuckerman Ct
- 6460 Tuckerman Ln
- 2660 Tuckerman Ct