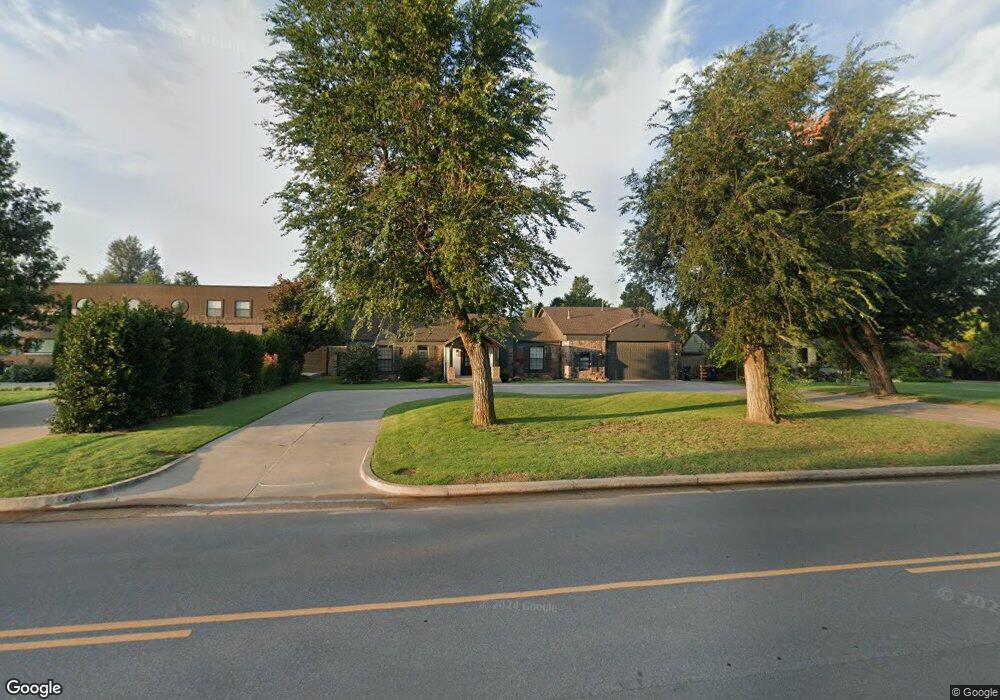
2640 W Wilshire Blvd Oklahoma City, OK 73116
Drakestone-Somerset NeighborhoodEstimated Value: $548,000 - $862,000
5
Beds
3
Baths
2,957
Sq Ft
$250/Sq Ft
Est. Value
About This Home
This home is located at 2640 W Wilshire Blvd, Oklahoma City, OK 73116 and is currently estimated at $738,484, approximately $249 per square foot. 2640 W Wilshire Blvd is a home located in Oklahoma County with nearby schools including Nichols Hills Elementary School, John Marshall Middle School, and John Marshall High School.
Ownership History
Date
Name
Owned For
Owner Type
Purchase Details
Closed on
Jul 2, 2024
Sold by
Goose Traders Revocable Trust
Bought by
Shelby Cummings Trust
Current Estimated Value
Purchase Details
Closed on
Aug 25, 2010
Sold by
Cummings Shelby G
Bought by
Goose Traders Revocable Trust
Home Financials for this Owner
Home Financials are based on the most recent Mortgage that was taken out on this home.
Original Mortgage
$125,000
Interest Rate
4.58%
Mortgage Type
New Conventional
Purchase Details
Closed on
Jun 28, 2005
Sold by
Cummings Shelby
Bought by
Goose Traders Revocable Trust
Purchase Details
Closed on
Aug 31, 2004
Sold by
Lamell Arpad Manfred Joseph and The Mary Agnes Lamell 1987 Rev
Bought by
Cummings Shelby
Create a Home Valuation Report for This Property
The Home Valuation Report is an in-depth analysis detailing your home's value as well as a comparison with similar homes in the area
Home Values in the Area
Average Home Value in this Area
Purchase History
| Date | Buyer | Sale Price | Title Company |
|---|---|---|---|
| Shelby Cummings Trust | -- | None Listed On Document | |
| Goose Traders Revocable Trust | -- | Stewart Abstract & Title Of | |
| Cummings Shelby G | -- | Stewart Abstract & Title Ok | |
| Goose Traders Revocable Trust | -- | -- | |
| Cummings Shelby | $159,000 | Stewart Abstract & Title Of |
Source: Public Records
Mortgage History
| Date | Status | Borrower | Loan Amount |
|---|---|---|---|
| Previous Owner | Cummings Shelby | $50,000 | |
| Previous Owner | Cummings Shelby G | $125,000 | |
| Previous Owner | Cummings Shelby | $60,000 | |
| Previous Owner | Cummings Shelby | $60,483 |
Source: Public Records
Tax History Compared to Growth
Tax History
| Year | Tax Paid | Tax Assessment Tax Assessment Total Assessment is a certain percentage of the fair market value that is determined by local assessors to be the total taxable value of land and additions on the property. | Land | Improvement |
|---|---|---|---|---|
| 2024 | $5,358 | $48,055 | $4,958 | $43,097 |
| 2023 | $5,358 | $44,626 | $4,350 | $40,276 |
| 2022 | $4,979 | $43,326 | $5,142 | $38,184 |
| 2021 | $4,833 | $42,065 | $5,036 | $37,029 |
| 2020 | $4,744 | $40,840 | $4,599 | $36,241 |
| 2019 | $4,599 | $39,650 | $4,145 | $35,505 |
| 2018 | $4,254 | $38,496 | $0 | $0 |
| 2017 | $4,123 | $37,374 | $4,498 | $32,876 |
| 2016 | $4,002 | $36,286 | $4,343 | $31,943 |
| 2015 | $3,919 | $35,229 | $4,785 | $30,444 |
| 2014 | $4,108 | $37,090 | $4,785 | $32,305 |
Source: Public Records
Map
Nearby Homes
- 2718 W Wilshire Blvd
- 2541 W Wilshire Blvd
- 2525 Somerset Place
- 2825 NW Grand Blvd Unit 24
- 2825 NW Grand Blvd Unit 14
- 2716 W Country Club Dr
- 2760 W Country Club Dr
- 2904 Somerset Place
- 2908 Somerset Place
- 2913 Somerset Place
- 2920 Somerset Place
- 3009 W Wilshire Blvd
- 3021 W Wilshire Blvd
- 1811 Guilford Ln
- 2935 NW Grand Blvd
- 2609 Dorchester Dr
- 1804 Guilford Ln
- 1908 Dorchester Dr
- 2916 Middlesex Dr
- 2832 Warwick Dr
- 2700 W Wilshire Blvd
- 2632 W Wilshire Blvd
- 2624 W Wilshire Blvd
- 2641 Somerset Place
- 2708 W Wilshire Blvd
- 2701 Somerset Place
- 2633 Somerset Place
- 2709 Somerset Place
- 2616 W Wilshire Blvd
- 2717 Somerset Place
- 2641 W Wilshire Blvd
- 2635 W Wilshire Blvd
- 2701 W Wilshire Blvd
- 2617 Somerset Place
- 2627 W Wilshire Blvd
- 2709 W Wilshire Blvd
- 2725 Somerset Place
- 2608 W Wilshire Blvd
- 2726 W Wilshire Blvd
- 2717 W Wilshire Blvd