Estimated Value: $443,573 - $484,000
3
Beds
2
Baths
2,024
Sq Ft
$231/Sq Ft
Est. Value
About This Home
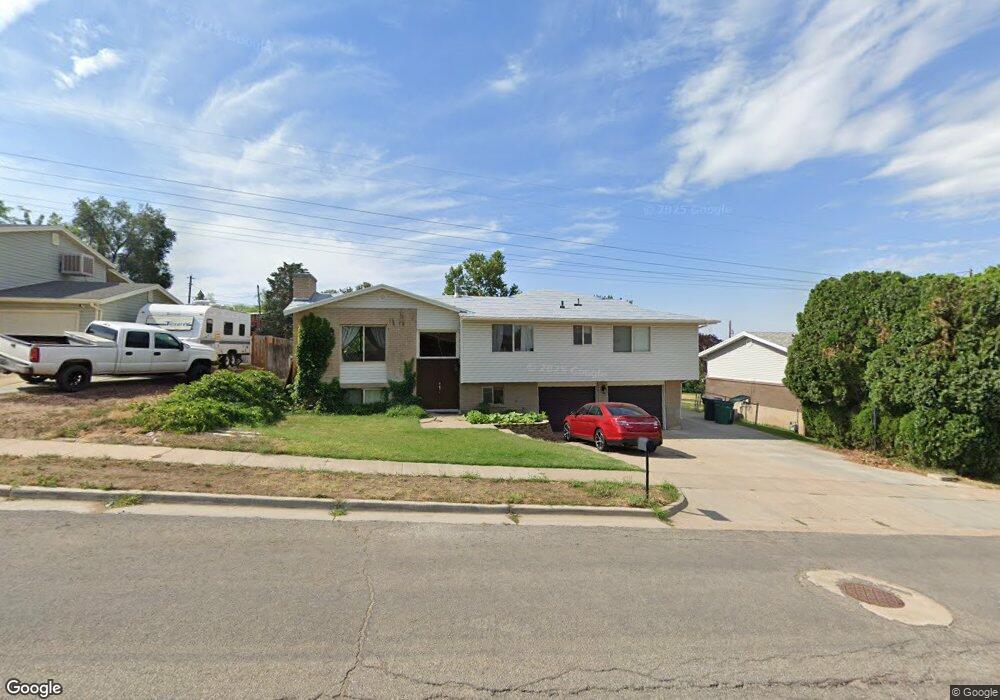
This home is located at 2641 W 4550 S, Roy, UT 84067 and is currently estimated at $467,393, approximately $230 per square foot. 2641 W 4550 S is a home located in Weber County with nearby schools including Valley View School, Sand Ridge Junior High School, and Roy High School.
Ownership History
Date
Name
Owned For
Owner Type
Purchase Details
Closed on
Jul 13, 2001
Sold by
Conseco Finance Servicing Corp
Bought by
Wild Leo L
Current Estimated Value
Home Financials for this Owner
Home Financials are based on the most recent Mortgage that was taken out on this home.
Original Mortgage
$116,955
Outstanding Balance
$45,464
Interest Rate
7.26%
Estimated Equity
$421,929
Purchase Details
Closed on
Jul 12, 2001
Sold by
Wild Leo
Bought by
Wild Leo and Wild Kay
Home Financials for this Owner
Home Financials are based on the most recent Mortgage that was taken out on this home.
Original Mortgage
$116,955
Outstanding Balance
$45,464
Interest Rate
7.26%
Estimated Equity
$421,929
Purchase Details
Closed on
Feb 15, 2001
Sold by
Hankins Steven M and Hankins Mary J
Bought by
Conseco Finance Servicing Corp
Create a Home Valuation Report for This Property
The Home Valuation Report is an in-depth analysis detailing your home's value as well as a comparison with similar homes in the area
Home Values in the Area
Average Home Value in this Area
Purchase History
| Date | Buyer | Sale Price | Title Company |
|---|---|---|---|
| Wild Leo L | -- | Gateway Title | |
| Wild Leo | -- | Bonneville Title | |
| Conseco Finance Servicing Corp | $112,576 | Backman Stewart Title |
Source: Public Records
Mortgage History
| Date | Status | Borrower | Loan Amount |
|---|---|---|---|
| Open | Wild Leo L | $116,955 | |
| Closed | Wild Leo L | $4,678 |
Source: Public Records
Tax History
| Year | Tax Paid | Tax Assessment Tax Assessment Total Assessment is a certain percentage of the fair market value that is determined by local assessors to be the total taxable value of land and additions on the property. | Land | Improvement |
|---|---|---|---|---|
| 2025 | $2,911 | $465,545 | $115,201 | $350,344 |
| 2024 | $2,838 | $251,349 | $63,360 | $187,989 |
| 2023 | $2,796 | $248,600 | $61,801 | $186,799 |
| 2022 | $2,756 | $251,350 | $56,405 | $194,945 |
| 2021 | $2,259 | $338,000 | $72,234 | $265,766 |
| 2020 | $2,145 | $295,000 | $72,234 | $222,766 |
| 2019 | $2,056 | $266,000 | $41,914 | $224,086 |
| 2018 | $2,037 | $249,000 | $39,782 | $209,218 |
| 2017 | $1,757 | $199,000 | $36,755 | $162,245 |
| 2016 | $1,714 | $104,583 | $19,485 | $85,098 |
| 2015 | $1,538 | $95,563 | $19,485 | $76,078 |
| 2014 | $1,551 | $95,479 | $19,485 | $75,994 |
Source: Public Records
Map
Nearby Homes
Your Personal Tour Guide
Ask me questions while you tour the home.