Estimated Value: $388,000 - $438,000
4
Beds
2
Baths
1,257
Sq Ft
$329/Sq Ft
Est. Value
About This Home
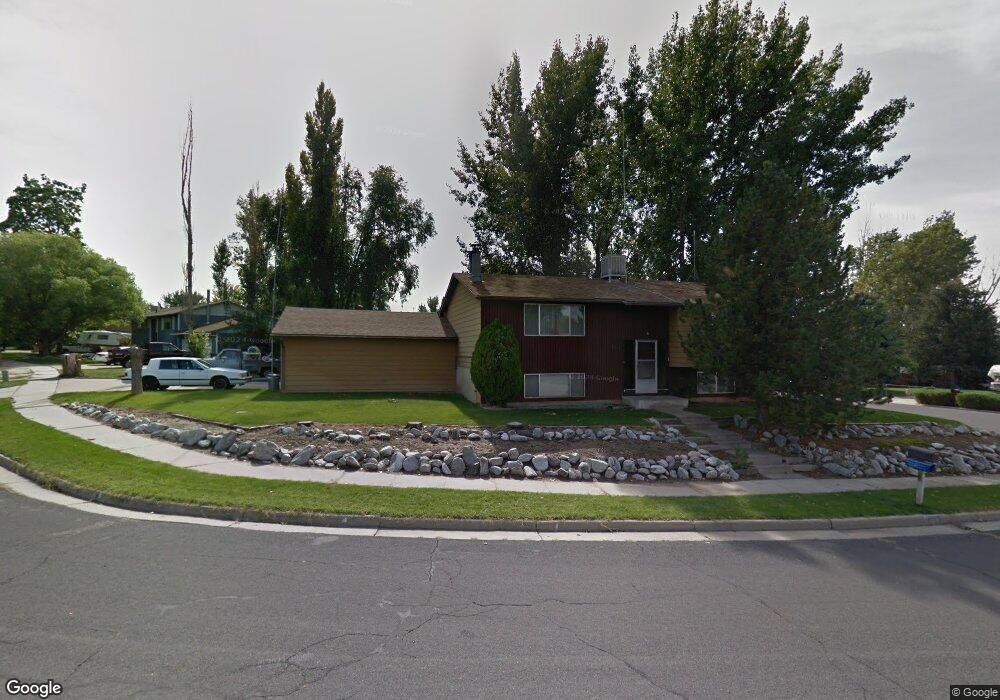
This home is located at 2641 W 6050 S, Roy, UT 84067 and is currently estimated at $413,343, approximately $328 per square foot. 2641 W 6050 S is a home located in Weber County with nearby schools including Municipal School, Roy Junior High School, and Roy High School.
Ownership History
Date
Name
Owned For
Owner Type
Purchase Details
Closed on
Feb 28, 2023
Sold by
Thomas John
Bought by
John G And Antoinette C Thomas Revocable Livi
Current Estimated Value
Purchase Details
Closed on
Mar 27, 2012
Sold by
Stacy W Thomas Revocable Living Trust
Bought by
Thomas John and Thomas Antoinette C
Home Financials for this Owner
Home Financials are based on the most recent Mortgage that was taken out on this home.
Original Mortgage
$218,010
Interest Rate
4%
Mortgage Type
VA
Create a Home Valuation Report for This Property
The Home Valuation Report is an in-depth analysis detailing your home's value as well as a comparison with similar homes in the area
Home Values in the Area
Average Home Value in this Area
Purchase History
| Date | Buyer | Sale Price | Title Company |
|---|---|---|---|
| John G And Antoinette C Thomas Revocable Livi | -- | None Listed On Document | |
| Thomas John | -- | Boston National Title | |
| Thomas Stacy W | -- | None Available |
Source: Public Records
Mortgage History
| Date | Status | Borrower | Loan Amount |
|---|---|---|---|
| Previous Owner | Thomas John | $218,010 |
Source: Public Records
Tax History Compared to Growth
Tax History
| Year | Tax Paid | Tax Assessment Tax Assessment Total Assessment is a certain percentage of the fair market value that is determined by local assessors to be the total taxable value of land and additions on the property. | Land | Improvement |
|---|---|---|---|---|
| 2025 | $514 | $409,535 | $121,827 | $287,708 |
| 2024 | $464 | $207,349 | $67,004 | $140,345 |
| 2023 | $590 | $207,900 | $66,315 | $141,585 |
| 2022 | $2,282 | $204,051 | $58,361 | $145,690 |
| 2021 | $527 | $241,000 | $75,808 | $165,192 |
| 2020 | $414 | $194,000 | $75,808 | $118,192 |
| 2019 | $374 | $170,000 | $45,624 | $124,376 |
| 2018 | $408 | $138,000 | $40,633 | $97,367 |
| 2017 | $429 | $130,000 | $37,667 | $92,333 |
| 2016 | $412 | $68,208 | $16,718 | $51,490 |
| 2015 | $188 | $68,208 | $16,718 | $51,490 |
| 2014 | $403 | $68,208 | $16,718 | $51,490 |
Source: Public Records
Map
Nearby Homes