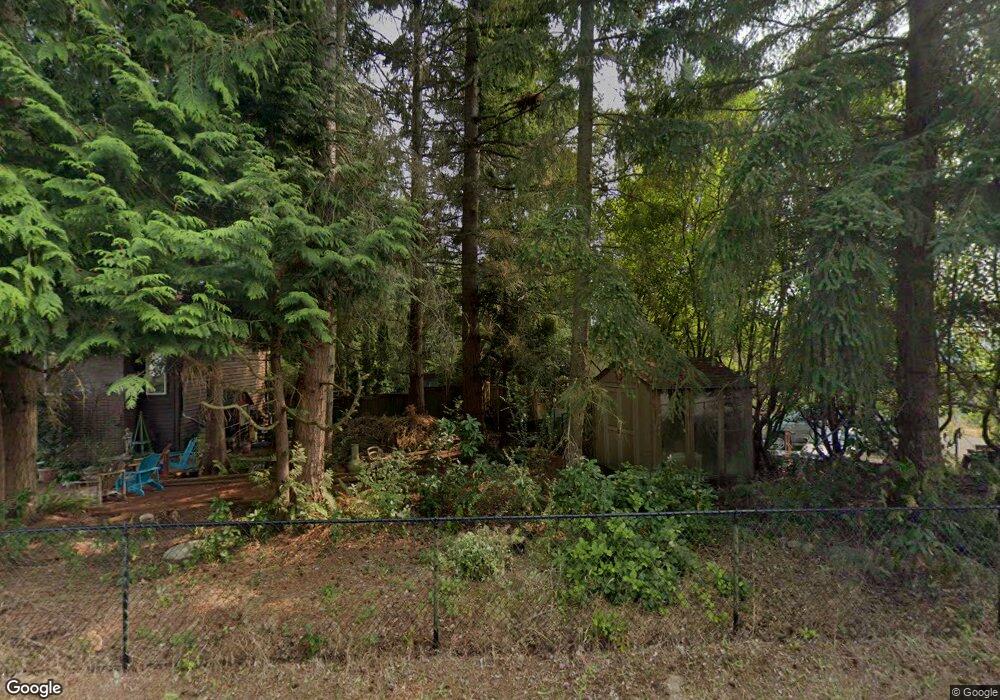
26416 Kingsview Loop NE Kingston, WA 98346
Kingston NeighborhoodEstimated Value: $571,000 - $698,000
3
Beds
2
Baths
1,746
Sq Ft
$353/Sq Ft
Est. Value
About This Home
This home is located at 26416 Kingsview Loop NE, Kingston, WA 98346 and is currently estimated at $616,398, approximately $353 per square foot. 26416 Kingsview Loop NE is a home located in Kitsap County with nearby schools including Richard Gordon Elementary School, Kingston Middle School, and Kingston High School.
Ownership History
Date
Name
Owned For
Owner Type
Purchase Details
Closed on
Jan 16, 2018
Sold by
Moreland Dana C
Bought by
Moreland Diana and Moreland Dana
Current Estimated Value
Home Financials for this Owner
Home Financials are based on the most recent Mortgage that was taken out on this home.
Original Mortgage
$239,435
Outstanding Balance
$202,003
Interest Rate
3.93%
Mortgage Type
New Conventional
Estimated Equity
$414,395
Purchase Details
Closed on
Oct 30, 2013
Sold by
Moreland Diana M and Moreland Dana
Bought by
Moreland Dana C
Home Financials for this Owner
Home Financials are based on the most recent Mortgage that was taken out on this home.
Original Mortgage
$210,300
Interest Rate
4.46%
Mortgage Type
New Conventional
Purchase Details
Closed on
May 20, 1997
Sold by
Martin Ruth A
Bought by
Moreland Dana C
Home Financials for this Owner
Home Financials are based on the most recent Mortgage that was taken out on this home.
Original Mortgage
$119,700
Interest Rate
5.2%
Create a Home Valuation Report for This Property
The Home Valuation Report is an in-depth analysis detailing your home's value as well as a comparison with similar homes in the area
Home Values in the Area
Average Home Value in this Area
Purchase History
| Date | Buyer | Sale Price | Title Company |
|---|---|---|---|
| Moreland Diana | -- | Land Title | |
| Moreland Dana C | -- | Accommodation | |
| Moreland Dana C | $126,000 | Charter Title Corp |
Source: Public Records
Mortgage History
| Date | Status | Borrower | Loan Amount |
|---|---|---|---|
| Open | Moreland Diana | $239,435 | |
| Closed | Moreland Dana C | $210,300 | |
| Closed | Moreland Dana C | $119,700 |
Source: Public Records
Tax History Compared to Growth
Tax History
| Year | Tax Paid | Tax Assessment Tax Assessment Total Assessment is a certain percentage of the fair market value that is determined by local assessors to be the total taxable value of land and additions on the property. | Land | Improvement |
|---|---|---|---|---|
| 2026 | $4,862 | $501,460 | $117,200 | $384,260 |
| 2025 | $4,862 | $527,830 | $104,650 | $423,180 |
| 2024 | $4,704 | $527,830 | $104,650 | $423,180 |
| 2023 | $4,476 | $494,190 | $91,160 | $403,030 |
| 2022 | $3,932 | $411,620 | $75,760 | $335,860 |
| 2021 | $3,663 | $349,680 | $64,200 | $285,480 |
| 2020 | $3,704 | $349,680 | $64,200 | $285,480 |
| 2019 | $3,253 | $306,280 | $52,760 | $253,520 |
| 2018 | $2,951 | $244,460 | $41,650 | $202,810 |
| 2017 | $2,961 | $244,460 | $41,650 | $202,810 |
| 2016 | $2,767 | $209,130 | $39,670 | $169,460 |
| 2015 | $2,749 | $209,130 | $39,670 | $169,460 |
| 2014 | -- | $199,790 | $39,670 | $160,120 |
| 2013 | -- | $195,290 | $56,800 | $138,490 |
Source: Public Records
Map
Nearby Homes
- 26425 Pennsylvania Ave NE Unit A34
- 26442 Gravity Ave NE
- 26702 Ohio Ave NE
- 26516 Lindvog Rd NE
- 25960 Central Ave NE
- 26005 Washington Blvd NE
- 26216 Dungeness Ave NE Unit C130
- 25825 Washington Blvd NE
- 26124 NE James Ln
- 10809 NE West Kingston Rd
- 28 xxx NE State Highway 104
- 0 Barber Cut Off Rd NE
- 10295 NE West Kingston Rd
- 27849 Lindvog Rd NE
- 9643 Goodfellow Ln NE
- 0 Bond Rd NE
- 24515 Madura Dr NE
- 10035 NE Kingston Farm Rd
- 24115 Madura Dr NE
- 9590 NE Leprechaun Ln
- 26418 Kingsview Loop NE
- 26414 Kingsview Loop NE
- 26475 Kingsview Loop NE
- 26412 Kingsview Loop NE
- 26435 Pennsylvania Ave NE Unit B49
- 26435 Pennsylvania Ave NE Unit 43
- 26435 Pennsylvania Ave NE Unit 66
- 26435 Pennsylvania Ave NE Unit 53
- 26435 Pennsylvania Ave NE Unit 50
- 26435 Pennsylvania Ave NE Unit 47
- 26435 Pennsylvania Ave NE Unit 48
- 26435 Pennsylvania Ave NE Unit 52
- 26435 Pennsylvania Ave NE Unit 38
- 26435 Pennsylvania Ave NE Unit 51
- 26435 Pennsylvania Ave NE Unit A-36
- 26435 Pennsylvania Ave NE Unit 50
- 26435 Pennsylvania Ave NE Unit B-39
- 26435 Pennsylvania Ave NE Unit 47
- 26435 Pennsylvania Ave NE Unit 52
- 26435 Pennsylvania Ave NE