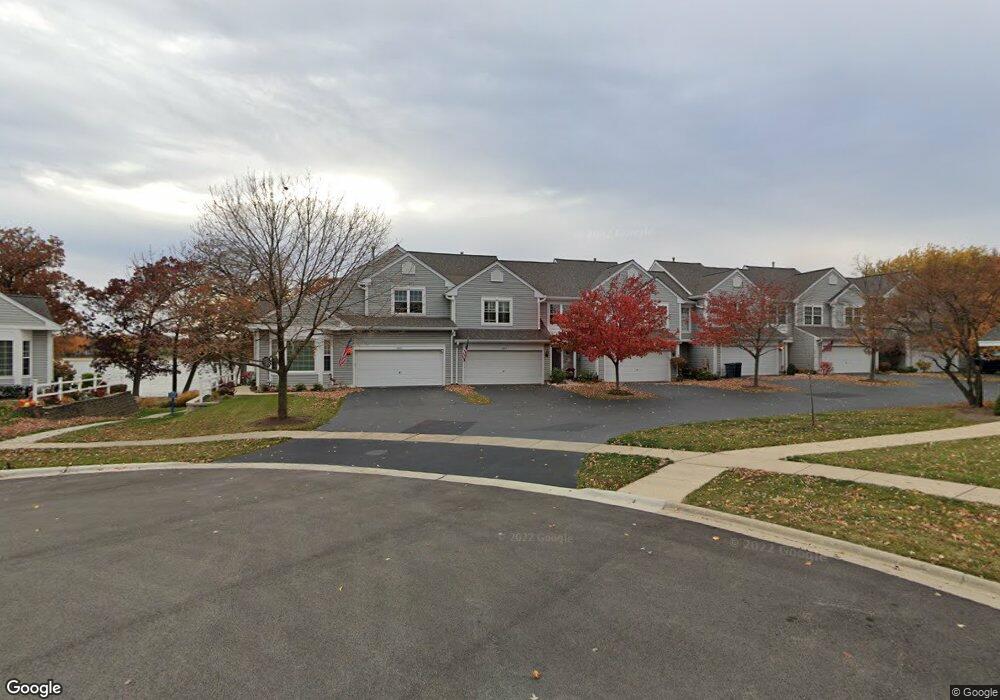
26417 W Vista Ct Unit 32 Ingleside, IL 60041
Wooster Lake NeighborhoodEstimated Value: $264,005 - $300,000
--
Bed
2
Baths
1,336
Sq Ft
$212/Sq Ft
Est. Value
About This Home
This home is located at 26417 W Vista Ct Unit 32, Ingleside, IL 60041 and is currently estimated at $283,251, approximately $212 per square foot. 26417 W Vista Ct Unit 32 is a home located in Lake County with nearby schools including Big Hollow Primary School, Big Hollow Elementary School, and Big Hollow Middle School.
Ownership History
Date
Name
Owned For
Owner Type
Purchase Details
Closed on
Jul 19, 2022
Sold by
Krennrich and Dorothy
Bought by
Felmet Susan
Current Estimated Value
Home Financials for this Owner
Home Financials are based on the most recent Mortgage that was taken out on this home.
Original Mortgage
$259,232
Outstanding Balance
$247,483
Interest Rate
5.5%
Mortgage Type
New Conventional
Estimated Equity
$35,768
Purchase Details
Closed on
Oct 31, 2002
Sold by
Scott Lillian M and Weigt Ellen M
Bought by
Krennrich Otto and Krennrich Dorothy
Purchase Details
Closed on
Nov 10, 1997
Sold by
Harris Bank Palatine
Bought by
Scott Lillian M
Home Financials for this Owner
Home Financials are based on the most recent Mortgage that was taken out on this home.
Original Mortgage
$30,000
Interest Rate
7.32%
Mortgage Type
Purchase Money Mortgage
Create a Home Valuation Report for This Property
The Home Valuation Report is an in-depth analysis detailing your home's value as well as a comparison with similar homes in the area
Home Values in the Area
Average Home Value in this Area
Purchase History
| Date | Buyer | Sale Price | Title Company |
|---|---|---|---|
| Felmet Susan | $267,500 | First American Title | |
| Krennrich Otto | $190,000 | -- | |
| Scott Lillian M | $191,500 | Ticor Title Insurance Compan |
Source: Public Records
Mortgage History
| Date | Status | Borrower | Loan Amount |
|---|---|---|---|
| Open | Felmet Susan | $259,232 | |
| Previous Owner | Scott Lillian M | $30,000 |
Source: Public Records
Tax History Compared to Growth
Tax History
| Year | Tax Paid | Tax Assessment Tax Assessment Total Assessment is a certain percentage of the fair market value that is determined by local assessors to be the total taxable value of land and additions on the property. | Land | Improvement |
|---|---|---|---|---|
| 2024 | $3,563 | $80,579 | $12,848 | $67,731 |
| 2023 | $2,552 | $64,498 | $12,104 | $52,394 |
| 2022 | $2,552 | $60,706 | $9,405 | $51,301 |
| 2021 | $2,678 | $57,221 | $8,865 | $48,356 |
| 2020 | $2,765 | $54,402 | $8,738 | $45,664 |
| 2019 | $2,750 | $52,169 | $8,379 | $43,790 |
| 2018 | $2,825 | $50,267 | $7,942 | $42,325 |
| 2017 | $2,927 | $50,267 | $7,341 | $42,926 |
| 2016 | $3,261 | $45,973 | $6,714 | $39,259 |
| 2015 | $3,390 | $42,901 | $6,265 | $36,636 |
| 2014 | $3,288 | $41,144 | $5,983 | $35,161 |
| 2012 | $3,416 | $42,122 | $6,234 | $35,888 |
Source: Public Records
Map
Nearby Homes
- 26183 W Wooster Lake Ave
- 26681 W Wooster Lake Dr
- 35025 N Ingleside Dr
- 34966 N Forest Ave
- 26297 W Larkin Ln
- 642 Key Largo Dr Unit 82
- 26276 W Larkin Ln
- 35107 N Rosewood Ave
- 34550 N Wilson Rd
- 35063 N Emerald Shores Ct
- 35080 N Ellen Dr
- 545 Blue Springs Dr
- 26931 W Marion Ct
- 26177 W Lakeview Ave
- 35105 N Ingleside Dr
- 27254 W Nippersink Rd
- 35242 N Moody St
- 25644 W Brooks Farm Rd
- 34052 N Fischer Dr
- 34113 N Primrose Ct
- 26411 W Vista Ct Unit 31
- 26423 W Vista Ct Unit 33
- 26429 W Vista Ct Unit 34
- 26435 W Vista Ct Unit 35
- 26407 W Vista Ct Unit 46
- 26441 W Vista Ct Unit 36
- 26401 W Vista Ct Unit 45
- 26395 W Vista Ct Unit 44
- 26389 W Vista Ct Unit 43
- 34734 N Lakeside Dr Unit 11
- 26377 W Vista Ct Unit 41
- 26377 W Vista Ct Unit 1
- 26400 W Wooster Lake Dr
- 34730 N Lakeside Dr Unit 1
- 34730 N Lakeside Dr Unit 1-2
- 34730 N Lakeside Dr
- 34698 N Lakeside Dr Unit 22
- 34726 N Lakeside Dr Unit 13
- 34726 N Lakeside Dr Unit 34726